Ask Your Question
9

how do you plot graphs in opencv projects?

asked 2015-10-14 15:03:40 -0600

theodore gravatar image

updated 2015-10-14 15:37:06 -0600

Hey guys, I was just wondering, there are cases where sometimes you need to plot a graph in real time within a project in order to keep track or evaluate data or for any other possible reason.

At the moment OpenCV does not support such a functionality - right? please correct me if I am wrong here, maybe the 3.x version introduced something that I am not aware - and from a thorough search that I did I only found this two libraries, [1] and [2] that somehow try to simulate such a wanna be plotting functionality with the use of OpenCV. However though I appreciate the effort of their authors, both are quite old, meaning they are using the old C api and for sure they are not something close to functional, like matlab, gnuplot, etc... So, here comes my question how do you guys do it?

I was looking also at QWT and some examples but it does not seem that convenient regarding also that you need to include Qt libraries and create a project in a form of application since you need to start a QApplication object.

My wonder was that OpenCV as a mature and really known library in computer vision and image processing fields should have such a functionality or to embed it from another external library which is specifically for that reason, since I thing such a functionality is quite some times necessary.

Moreover, I was also thinking on starting something from scratch based on the first two libraries that I pointed here, but I am not that confident that I would be able to provide a solution and reach it in such a level that I would be also able to contribute it to the main OpenCV's source code. So if someone is interested we could also arrange a group that will start such a task in our spare time and when we reach it in a good level to contribute it to OpenCV.

So I would like to hear your opinions and why not enlighten and advice me, regarding what you are using or how you do it in general or if you are interested to create something together if there is a need about it. Be aware though that I am not talking about offline plotting since this is quite easy to manage and there are a lot of tools out there that make the drill in more than a perfect way ;-).

edit retag flag offensive close merge delete

Comments

LBerger gravatar imageLBerger ( 2015-10-14 15:11:40 -0600 )edit

@LBerger thanks for the plplot library. Let's see if someone else has any other proposal.

theodore gravatar imagetheodore ( 2015-10-15 04:36:08 -0600 )edit

+1. It would be a great feature to have into OpenCV.

I used a library call ViSP (dedicated to virtual visual servoing tasks) for my work and I used the built-in plotter class but usually it is only for debugging and I saved the plain results into a text file to generate later the figure.

Eduardo gravatar imageEduardo ( 2015-10-15 04:59:24 -0600 )edit

I think that's to plot graph with opencv library should be compatible with cmake C++ python and java ios and android QT (of windows, mac, linux). I don't know an open source library with all these things.

plplot is not compatible with android and ios and not optimize for real time. @Eduardo what's about ViSP?

LBerger gravatar imageLBerger ( 2015-10-15 09:13:45 -0600 )edit

As far as I know, ViSP is compatible only with Linux, MacOs and Windows. The plotting class seems to use the display (displayX, displayGDI, displayGTK, ...) to draw the curves and the text, but I don't have much information about it.

Maybe it is possible to enable the plotting class only on compatible or suitable environment ?

Eduardo gravatar imageEduardo ( 2015-10-15 13:04:47 -0600 )edit

4 answers

Sort by ยป oldest newest most voted
6

answered 2015-10-16 04:43:03 -0600

Guys actually plotting functionality is awaiting its entrance in the library!

  1. Nuno Moutinho started embedding plotting functionality in OpenCV. I have been using it ever since and am happily awaiting the final merge. Take a look at the plot module.
  2. I recently added markers to support even more plotting possibilities in the future right here.

So what I suggest is that if you want to built further on plotting functionality for OpenCV, that we work together to improve this module and add functionality to it.

edit flag offensive delete link more

Comments

@StevenPuttemans thanks for pointing. This is what I was meaning when I was saying that might be something that I am not aware :-). Perfect!!! This one seems to be what I was looking for, and I guess the same case is for other users. Super!!!!!

theodore gravatar imagetheodore ( 2015-10-16 05:18:49 -0600 )edit

however, from a quick overview it seems that it has stuck for some reason, and the author is quite some time since he gave any feedback. Do you have any clue why?

theodore gravatar imagetheodore ( 2015-10-16 05:33:56 -0600 )edit
1

Contrib had problems with new functionality and correct buildbot checks. There is still the need of a dev to focus on it and merge it. Let me remind them to continue.

StevenPuttemans gravatar imageStevenPuttemans ( 2015-10-16 05:40:35 -0600 )edit

@StevenPuttemans can you provide an example, how you are using it. I downloaded the files from github and I was trying to use it but without success so far.

theodore gravatar imagetheodore ( 2015-10-16 15:37:14 -0600 )edit

@theodore I should dig it up again on how I did it exactly, when he first committed the functionality. That was before the big 3.0 changes I think ... so it might be that it is not working as expected. Might take a look again in the near future! Or you can simply ask him for a code sample on his github repo?

StevenPuttemans gravatar imageStevenPuttemans ( 2015-10-20 02:49:50 -0600 )edit
2

@everyone, the plot module has just been merged officially!

StevenPuttemans gravatar imageStevenPuttemans ( 2015-12-14 06:53:13 -0600 )edit
1

nice news, thanks ;-)

theodore gravatar imagetheodore ( 2015-12-14 15:21:31 -0600 )edit
1

@theodore have you try it already? Hope you find it useful ;) it still has a lot to improve though.

m0utinho gravatar imagem0utinho ( 2015-12-27 06:49:54 -0600 )edit
1

@m0utinho could you share a simple code to test it ?

sturkmen gravatar imagesturkmen ( 2015-12-27 07:57:44 -0600 )edit
1

@sturkmen check bellow:

Mat data; 
Mat plot_result;
//-------------------------------//
//     fill your data here
//-------------------------------//
Ptr<plot::Plot2d> plot;
plot = plot::createPlot2d(data);
plot->render(plot_result);
//-------------------------------//
//         show the plot
//-------------------------------//
imshow("plot",plot_result );

it's also in the instructions in github. @m0utinho yes I tried it and it seems quite nice. However, I think that still needs some work and some features to be added. I do not know how much time can you spend to it, I remember that you were busy with your Phd thesis, I would like to help though if I get some time.

theodore gravatar imagetheodore ( 2015-12-27 08:07:29 -0600 )edit
6

answered 2015-12-27 17:05:41 -0600

updated 2017-11-11 15:17:47 -0600

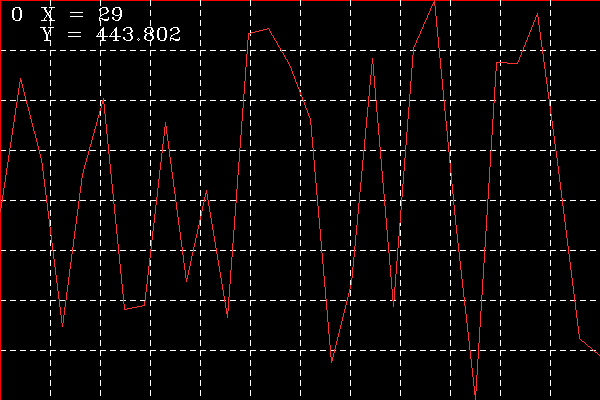
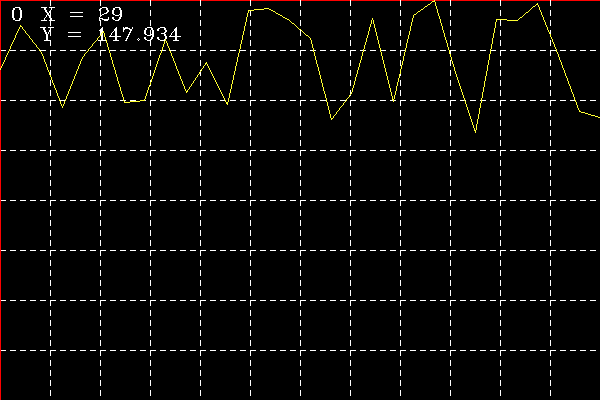
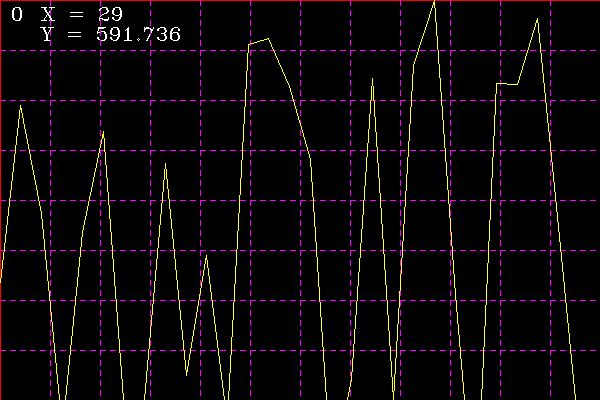
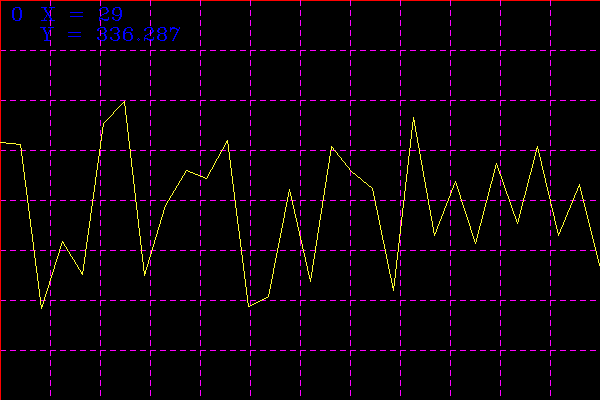
i tried to understand usage of Plot2d class maybe the code below will be useful for someone who want to try.

#include <opencv2/highgui.hpp>
#include <opencv2/plot.hpp>

using namespace cv;

int main(int argc, char** argv)
{
   // Plot data must be a 1xN or Nx1 matrix.
   // Plot data type must be double (CV_64F) 
    Mat data( 30, 1, CV_64F );
    randu( data, 0, 500 ); // random values

    Mat plot_result;

    Ptr<plot::Plot2d> plot = plot::Plot2d::create(data);
    plot->setPlotBackgroundColor( Scalar( 50, 50, 50 ) );
    plot->setPlotLineColor( Scalar( 50, 50, 255 ) );
    plot->render( plot_result );

    imshow( "plot", plot_result );
    waitKey();

    plot->setPlotLineColor( Scalar( 50, 255, 255 ) );
    data = data / 3;
    plot->render( plot_result );

    imshow( "plot", plot_result );
    waitKey();

    plot->setPlotGridColor( Scalar( 255, 0, 255 ) );
    data = data * 4;
    plot->render( plot_result );

    imshow( "plot", plot_result );
    waitKey();

    plot->setPlotTextColor( Scalar( 255, 0, 0 ) );
    randu( data, 100, 400 );
    plot->render( plot_result );

    imshow( "plot", plot_result );
    waitKey();

    return 0;
}

sample java code

import org.opencv.core.Core;
import org.opencv.core.Scalar;
import org.opencv.core.CvType;
import org.opencv.core.Mat;
import org.opencv.imgcodecs.Imgcodecs;
import org.opencv.plot.Plot2d;
public class test
{
   public static void main( String[] args )
   {
      System.loadLibrary( Core.NATIVE_LIBRARY_NAME );
      Mat data = new Mat(1, 20, CvType.CV_64F);
      Core.randu(data, 1, 10);
      Plot2d plot = Plot2d.create(data);
      Mat mplot = new Mat();
      plot.setPlotLineColor(new Scalar(0,0,255));
      plot.render(mplot);
      Imgcodecs.imwrite("e:/test.png", mplot);
   }
}

image description


image description


image description


image description

edit flag offensive delete link more

Comments

2

@sturkmen add also the result images for visualization purposes

theodore gravatar imagetheodore ( 2015-12-27 18:35:27 -0600 )edit
1

I haven't try OpenCV 3.1 yet, do you know if you can do real-time plotting ?

Eduardo gravatar imageEduardo ( 2015-12-29 17:49:11 -0600 )edit
2

yes, you can do it by adding new values to your data matrix and update with plot->render and imshow

sturkmen gravatar imagesturkmen ( 2015-12-29 18:12:30 -0600 )edit

@m0utinho what is your opininon to adding feature of drawing multiple data series

sturkmen gravatar imagesturkmen ( 2016-01-23 12:52:29 -0600 )edit
1

@sturkmen I am going to create a thread specifically for this module so we can discuss and suggest ad-ons to the Plot2d module. That is one of my list ;) whenever I have time I will start improving this module with all the suggestions. If you want you can create the thread and start the discussion, it is ok to me :) I will then use it as a TODO list.

m0utinho gravatar imagem0utinho ( 2016-01-24 12:06:11 -0600 )edit

i did not try but seems good. http://research.project-10.de/dgm/doc...

sturkmen gravatar imagesturkmen ( 2016-08-20 15:03:39 -0600 )edit

niiiice one

azdoud.y gravatar imageazdoud.y ( 2017-01-03 05:58:35 -0600 )edit

I cannot import the plot import: org.opencv.plot.Plot2d; (java code) even though I have the latest version of OpenCV. Any ideas of why this might be happening?

EleDiam gravatar imageEleDiam ( 2017-11-21 05:17:07 -0600 )edit

you need to compile the latest source. because plot module is available with a PR recently after OpenCV 3.3.1 released

sturkmen gravatar imagesturkmen ( 2017-11-21 05:52:41 -0600 )edit

@sturkmen, how can I compile the latest source? The link you have sent me has instructions for cmake and cmake-gui command. Can I build opencv with extra modules in Android(java) sdk? If yes, do you know how I could do it? cc @berak

EleDiam gravatar imageEleDiam ( 2017-11-21 08:03:14 -0600 )edit
3

answered 2020-04-29 09:38:59 -0600

wpalfi gravatar image

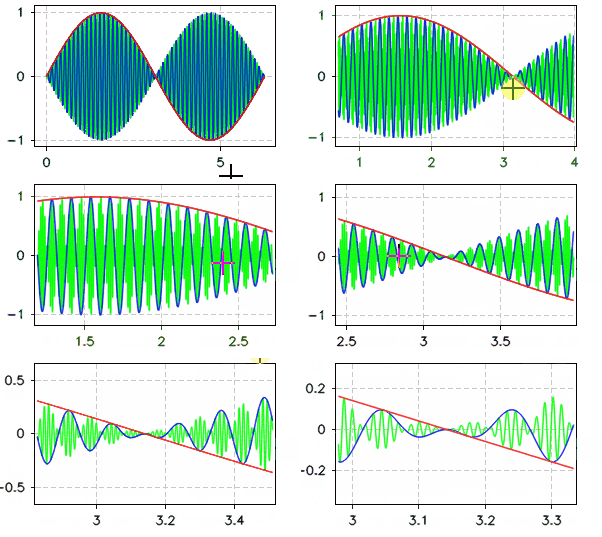
You could try Profactor CvPlot https://github.com/Profactor/cv-plot. (I am the developer). It is very easy to integrate, purely opencv based and can be extended with custom drawables. This is how you can plot to a cv::Mat or show a diagram with an interactive viewer:

#include <CvPlot/cvplot.h>
std::vector<double> x(20*1000), y1(x.size()), y2(x.size()), y3(x.size());
for (size_t i = 0; i < x.size(); i++) {
    x[i] = i * CV_2PI / x.size();
    y1[i] = std::sin(x[i]);
    y2[i] = y1[i] * std::sin(x[i]*50);
    y3[i] = y2[i] * std::sin(x[i]*500);
}
auto axes = CvPlot::makePlotAxes();
axes.create<CvPlot::Series>(x, y3, "-g");
axes.create<CvPlot::Series>(x, y2, "-b");
axes.create<CvPlot::Series>(x, y1, "-r");

//plot to a cv::Mat
cv::Mat mat = axes.render(300, 400);

//or show with interactive viewer
CvPlot::show("mywindow", axes);

image description

You may also want to try Leonardvandriel's cvplot. It works similar but cannot be extended with custom drawables.

edit flag offensive delete link more

Comments

Nice!

A feature that could be useful is 3D plotting. For instance to draw camera poses, coordinate frames, ...

And something like real-time plotting. This is useful in robotics for instance when plotting robot command. The computation time to plot should be fast.

Eduardo gravatar imageEduardo ( 2020-05-01 16:40:45 -0600 )edit
1

There are no plans to add 3D right now. Real time plotting is already possible. In fact it is one of the design goals of the library, see also https://github.com/Profactor/cv-plot/...

wpalfi gravatar imagewpalfi ( 2020-05-04 01:38:25 -0600 )edit

Maybe you could integrate your module into OpenCV contrib? There is already a plotting module in contrib but unmainted and not very elaborated.

At least you can add a link to your repository in the following tickets:

Eduardo gravatar imageEduardo ( 2020-05-25 18:09:24 -0600 )edit

@Eduardo Yes, could be interesting. I saw that there was some attempt to add leonardvandriel's cvplot, was it canceled?

wpalfi gravatar imagewpalfi ( 2020-05-26 05:00:48 -0600 )edit

I don't know about leonardvandriel's cvplot. Core OpenCV developers usually don't have the time and the resources to look at contrib code.

OpenCV contrib module mostly lives thanks to external contributions. If you have the time to integrate your module to OpenCV contrib repo, feel free to do it and open a PR on Github.

Only requirements would be that the code build on the OpenCV CI (the OpenCV buildbot), no or few external dependencies, not too recent C++ code (for instance C++17), ... Also, some documentation, sample code and test code if relevant. You can look at the merged PR if you want to have an idea about how contributed code should be.

Eduardo gravatar imageEduardo ( 2020-05-26 14:17:51 -0600 )edit
3

answered 2017-12-21 22:18:30 -0600

leenvand gravatar image

updated 2017-12-23 01:23:42 -0600

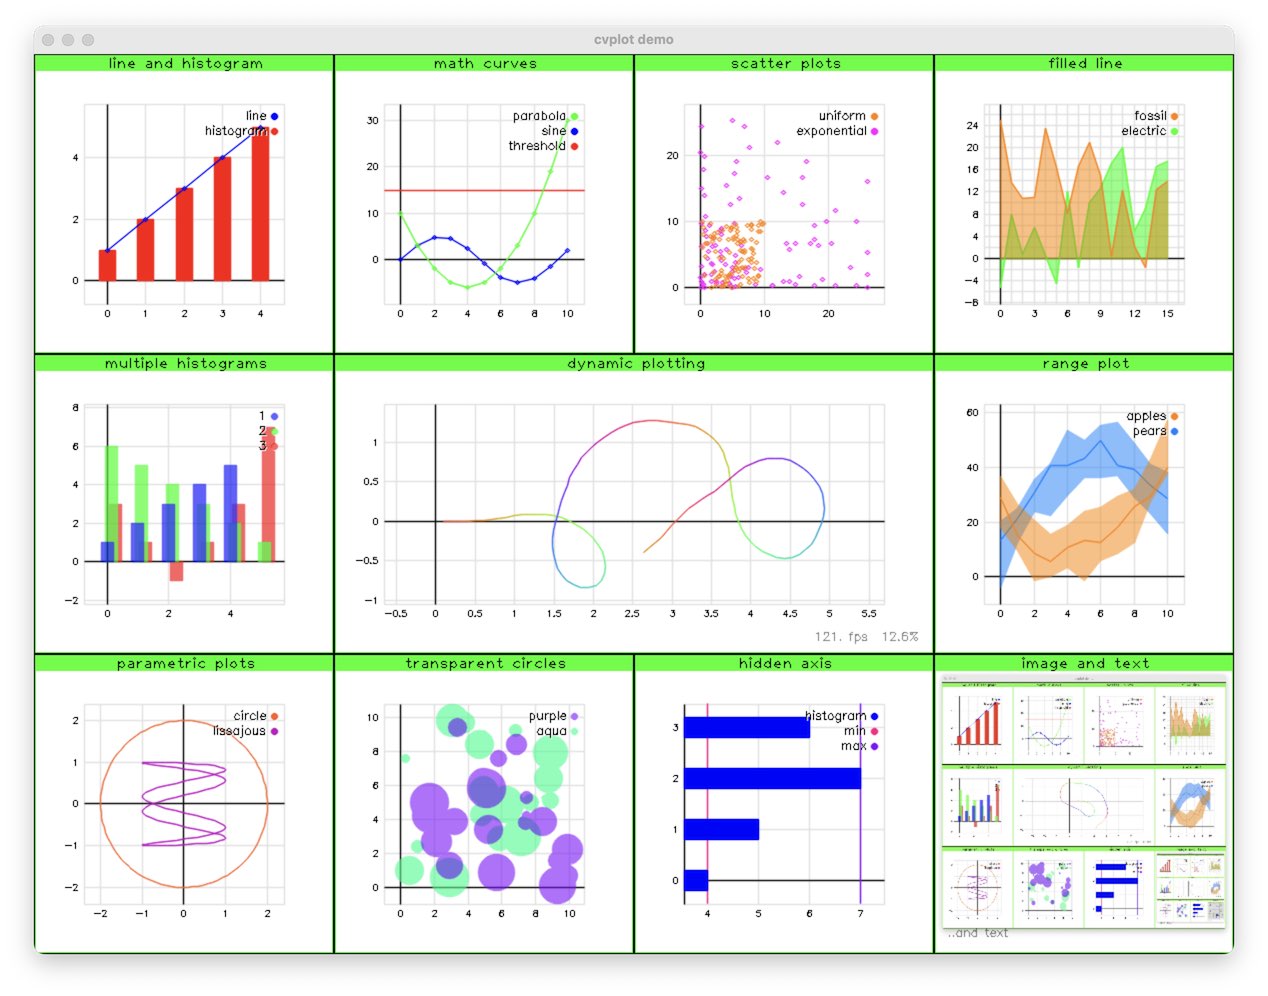
Try this cvplot framework. You can plot in real time and and have multiple plots in a single window.

image description

edit flag offensive delete link more

Comments

Nice framework!

StevenPuttemans gravatar imageStevenPuttemans ( 2017-12-31 06:48:02 -0600 )edit

really impressive work!!! nice :-)

theodore gravatar imagetheodore ( 2018-04-07 16:32:51 -0600 )edit

Question Tools

5 followers

Stats

Asked: 2015-10-14 15:03:40 -0600

Seen: 29,804 times

Last updated: Apr 29 '20