This forum is disabled, please visit https://forum.opencv.org
| | 1 | initial version |
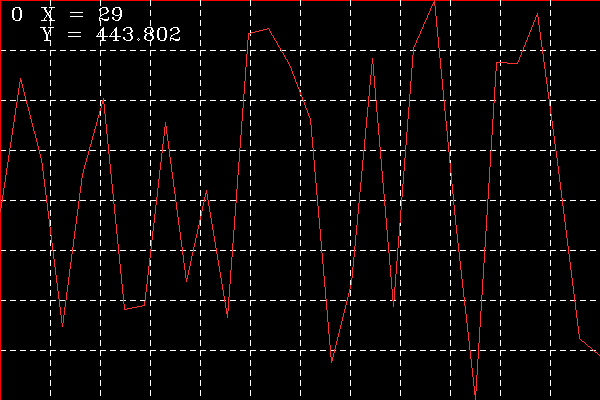
i tried to understand usage of Plot2d class maybe the code below will be useful for someone who want to try.
#include <opencv2/highgui.hpp>
#include <opencv2/plot.hpp>
using namespace cv;
int main(int argc, char** argv)
{
// Plot data must be a 1xN or Nx1 matrix.
// Plot data type must be double (CV_64F)
Mat data( 30, 1, CV_64F );
randu( data, 0, 500 ); // random values
Mat plot_result;
Ptr<plot::Plot2d> plot = plot::createPlot2d( data );
plot->setPlotBackgroundColor( Scalar( 50, 50, 50 ) ); // i think it is not implemented yet
plot->setPlotLineColor( Scalar( 50, 50, 255 ) );
plot->render( plot_result );
imshow( "plot", plot_result );
waitKey();
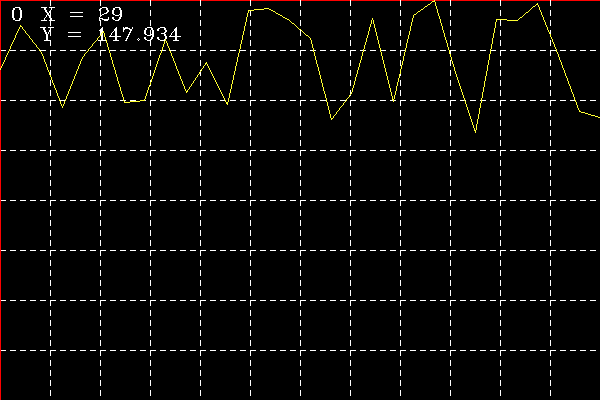
plot->setPlotLineColor( Scalar( 50, 255, 255 ) );
data = data / 3;
plot->render( plot_result );
imshow( "plot", plot_result );
waitKey();
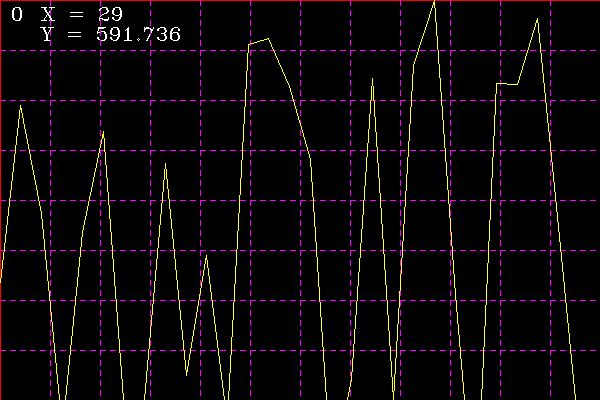
plot->setPlotGridColor( Scalar( 255, 0, 255 ) );
data = data * 4;
plot->render( plot_result );
imshow( "plot", plot_result );
waitKey();
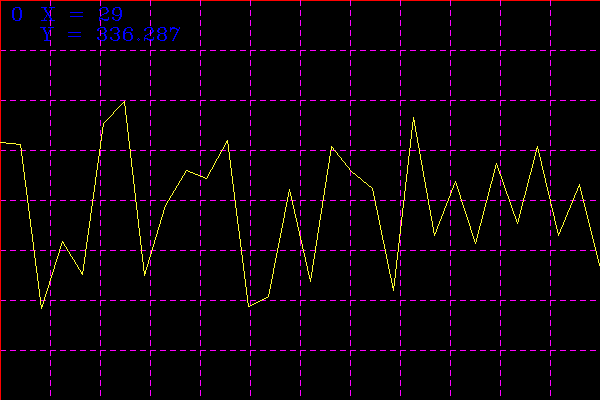
plot->setPlotTextColor( Scalar( 255, 0, 0 ) );
randu( data, 100, 400 );
plot->render( plot_result );
imshow( "plot", plot_result );
waitKey();
return 0;
}
| | 2 | No.2 Revision |
i tried to understand usage of Plot2d class maybe the code below will be useful for someone who want to try.
#include <opencv2/highgui.hpp>
#include <opencv2/plot.hpp>

using namespace cv;

int main(int argc, char** argv)
{
   // Plot data must be a 1xN or Nx1 matrix.
   // Plot data type must be double (CV_64F)
    Mat data( 30, 1, CV_64F );
    randu( data, 0, 500 ); // random values

    Mat plot_result;

    Ptr<plot::Plot2d> plot = plot::createPlot2d( data );
    plot->setPlotBackgroundColor( Scalar( 50, 50, 50 ) ); // i think it is not implemented yet
    plot->setPlotLineColor( Scalar( 50, 50, 255 ) );
    plot->render( plot_result );

    imshow( "plot", plot_result );
    waitKey();

    plot->setPlotLineColor( Scalar( 50, 255, 255 ) );
    data = data / 3;
    plot->render( plot_result );

    imshow( "plot", plot_result );
    waitKey();

    plot->setPlotGridColor( Scalar( 255, 0, 255 ) );
    data = data * 4;
    plot->render( plot_result );

    imshow( "plot", plot_result );
    waitKey();

    plot->setPlotTextColor( Scalar( 255, 0, 0 ) );
    randu( data, 100, 400 );
    plot->render( plot_result );

    imshow( "plot", plot_result );
    waitKey();

    return 0;
}
| | 3 | No.3 Revision |
i tried to understand usage of Plot2d class maybe the code below will be useful for someone who want to try.
#include <opencv2/highgui.hpp>
#include <opencv2/plot.hpp>

using namespace cv;

int main(int argc, char** argv)
{
   // Plot data must be a 1xN or Nx1 matrix.
   // Plot data type must be double (CV_64F)
    Mat data( 30, 1, CV_64F );
    randu( data, 0, 500 ); // random values

    Mat plot_result;

    Ptr<plot::Plot2d> plot = plot::createPlot2d( data );
    plot->setPlotBackgroundColor( Scalar( 50, 50, 50 ) ); // i think it is not implemented yet
    plot->setPlotLineColor( Scalar( 50, 50, 255 ) );
    plot->render( plot_result );

    imshow( "plot", plot_result );
    waitKey();

    plot->setPlotLineColor( Scalar( 50, 255, 255 ) );
    data = data / 3;
    plot->render( plot_result );

    imshow( "plot", plot_result );
    waitKey();

    plot->setPlotGridColor( Scalar( 255, 0, 255 ) );
    data = data * 4;
    plot->render( plot_result );

    imshow( "plot", plot_result );
    waitKey();

    plot->setPlotTextColor( Scalar( 255, 0, 0 ) );
    randu( data, 100, 400 );
    plot->render( plot_result );

    imshow( "plot", plot_result );
    waitKey();

    return 0;
}
sample java code
import org.opencv.core.Core;
import org.opencv.core.Scalar;
import org.opencv.core.CvType;
import org.opencv.core.Mat;
import org.opencv.imgcodecs.Imgcodecs;
import org.opencv.plot.Plot2d;
public class test
{
   public static void main( String[] args )
   {
      System.loadLibrary( Core.NATIVE_LIBRARY_NAME );
      Mat data = new Mat(1, 20, CvType.CV_64F);
      Core.randu(data, 1, 10);
      Plot2d plot = Plot2d.create(data);
      Mat mplot = new Mat();
      plot.setPlotLineColor(new Scalar(0,0,255));
      plot.render(mplot);
      Imgcodecs.imwrite("e:/test.png", mplot);
   }
}
| | 4 | No.4 Revision |
i tried to understand usage of Plot2d class maybe the code below will be useful for someone who want to try.
#include <opencv2/highgui.hpp>
#include <opencv2/plot.hpp>

using namespace cv;

int main(int argc, char** argv)
{
   // Plot data must be a 1xN or Nx1 matrix.
   // Plot data type must be double (CV_64F)
    Mat data( 30, 1, CV_64F );
    randu( data, 0, 500 ); // random values

    Mat plot_result;

    Ptr<plot::Plot2d> plot = plot::createPlot2d( data );
plot::Plot2d::create(data);
    plot->setPlotBackgroundColor( Scalar( 50, 50, 50 ) ); // i think it is not implemented yet
);
    plot->setPlotLineColor( Scalar( 50, 50, 255 ) );
    plot->render( plot_result );

    imshow( "plot", plot_result );
    waitKey();

    plot->setPlotLineColor( Scalar( 50, 255, 255 ) );
    data = data / 3;
    plot->render( plot_result );

    imshow( "plot", plot_result );
    waitKey();

    plot->setPlotGridColor( Scalar( 255, 0, 255 ) );
    data = data * 4;
    plot->render( plot_result );

    imshow( "plot", plot_result );
    waitKey();

    plot->setPlotTextColor( Scalar( 255, 0, 0 ) );
    randu( data, 100, 400 );
    plot->render( plot_result );

    imshow( "plot", plot_result );
    waitKey();

    return 0;
}
sample java code
import org.opencv.core.Core;
import org.opencv.core.Scalar;
import org.opencv.core.CvType;
import org.opencv.core.Mat;
import org.opencv.imgcodecs.Imgcodecs;
import org.opencv.plot.Plot2d;
public class test
{
   public static void main( String[] args )
   {
      System.loadLibrary( Core.NATIVE_LIBRARY_NAME );
      Mat data = new Mat(1, 20, CvType.CV_64F);
      Core.randu(data, 1, 10);
      Plot2d plot = Plot2d.create(data);
      Mat mplot = new Mat();
      plot.setPlotLineColor(new Scalar(0,0,255));
      plot.render(mplot);
      Imgcodecs.imwrite("e:/test.png", mplot);
   }
}
