Shape matching using fourier descriptor - Frequency domain
Hey algorithm enthusiast,
Here is an implementation I am trying to make it work for shape matching that is invariant to rotation, translation and scaling as per theory.
Reference Links
- http://www.isy.liu.se/cvl/edu/TSBB08/...
- http://homepages.inf.ed.ac.uk/rbf/CVo...
- http://users.monash.edu.au/~dengs/res...
- http://users.monash.edu.au/~dengs/res...
- https://homepages.cae.wisc.edu/~ece53...
- http://www.codeproject.com/Articles/1... (ref sample application in spatial domain)
What is the process that I tried
Get RGB input image, convert to gray scale
Guassian Blur the image with 3x3 kernel and perform thresholding
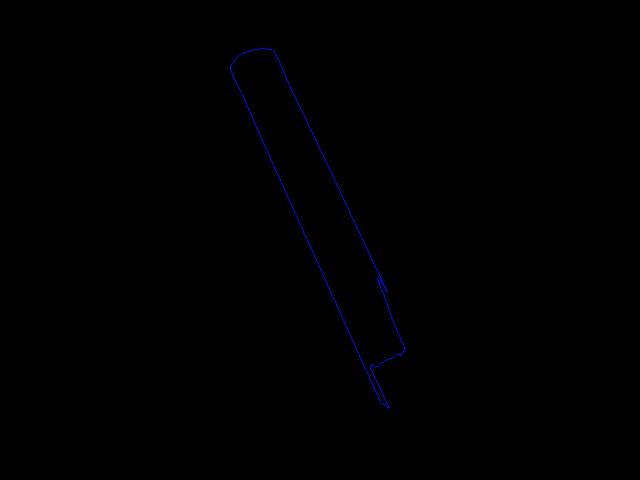
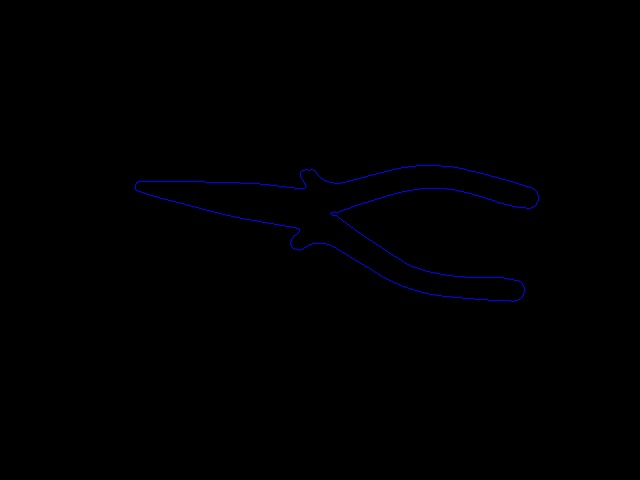
Do some morphological operation to close the edges and find external contour of this thresholded image
Find the largest contour that forms the boundary of desired object. The returned contour points are in counter clock wise direction, so reverse it to make it clockwise order. (As explained in few papers)
Perform differential coding (current coordinate - next coordinate) for contour coordinates and save it as vector of new points. Convert this to two planes (one for x and another for y).
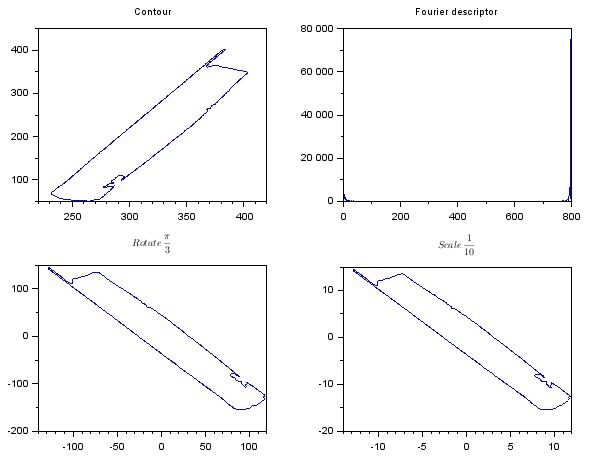
Perform DFT for these differential encoded contour points. Calculate Magnitude from result of DFT, discard DC coefficient and normalize other Fourier coefficients with first harmonic (this is done for scale invariancy).
Perform Euclidean distance for template image and input test image.
Stuck up with
The Euclidean distance calculated is coming same/closer for any test sample I give. Not sure where I do mistake. I do not find any sample implementation for frequency domain shape matching.
Please help in understanding any mistakes that is being done.
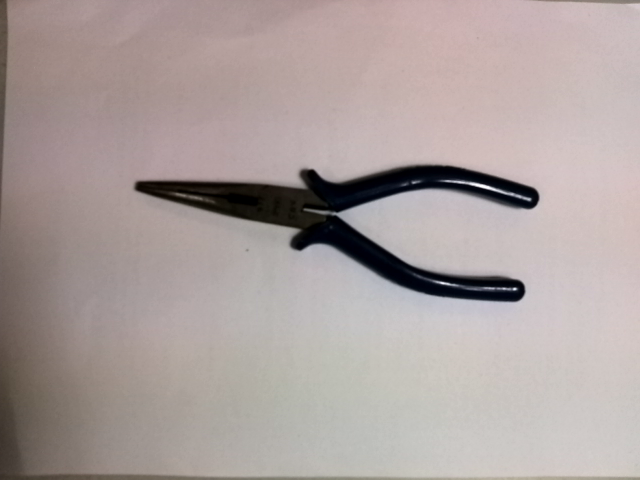
Sample image in recognition 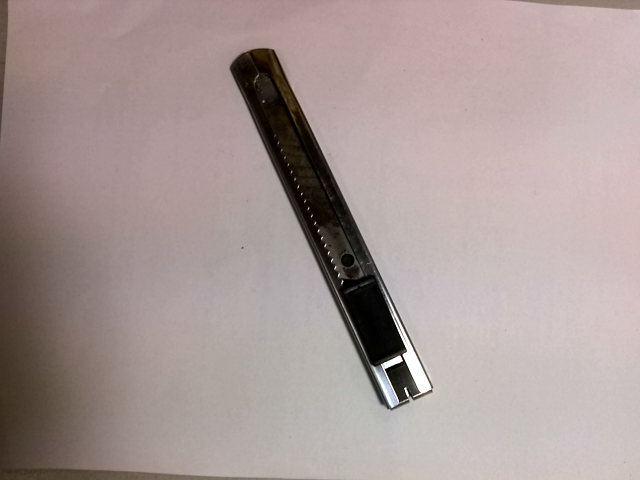
EDIT:
I am trying to perform rotation, scale and translation invariant shape matching using Fourier descriptor as proved in technical papers. I am making use of OpenCV 2.4.9 on Windows.
Just a note. If you can use OpenCV 3.0, Shape Context is available and it is exactly suited for this kind of problems.
Looks promising, will try and update you the result of Shape context in OpenCV 3.0.
@juanmanpr: Shape context in OpenCV 3.0 works well with their samples. But produces poor result with image attached in my original post. The distance value calculated by Shape context is high for same type of object, but low for different object, and varies with same object.
@Spark, did you try tweaking the parameters? There is a lot to try there, I would start by looking at the vectors of points that form the edges, the rotation invariance, sometimes you should mirror your training shapes along the two axis so you achieve more robustness
Hi, I am currently doing a project of comparing pictures as well. Now, I could only take out the edge, then find the contours and draw them with colors. However, the edges are not connected, I heard that morphological operation can close the edge. Could you elaborate more on which operation should I use ? Thanks!