This forum is disabled, please visit https://forum.opencv.org
| | 1 | initial version |
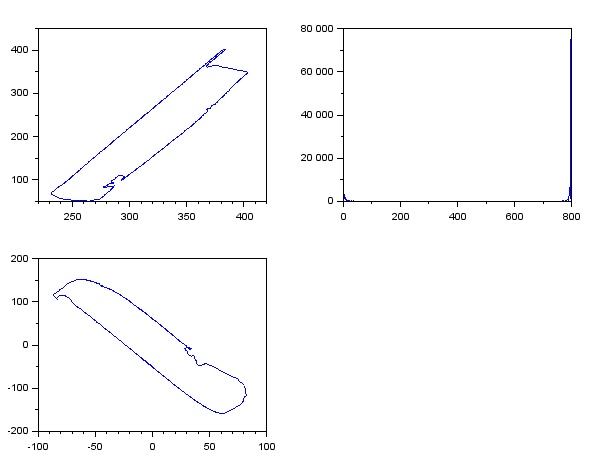
Hi,
I don't know exactely what you want to do with fourier descriptor but you must care about number of point in your contour. May be you should use first a software like matlab scilab octave.... to check your algorithm For example with scilab a small program rotating a shape :
fs=mopen('Ctr.txt',"r");
c=[];
while meof(fs)==0
    x=mfscanf(2,fs,"%d")
    c=[c x];
end
mclose(fs)
z=c(1,:)+%i*c(2,:);
Z=fft(z)
Z(1)=0;
scf(1)
clf()
subplot(2,2,1)
plot(c(1,:),c(2,:))
subplot(2,2,2)
Z(1)=0;
f=(0:length(z)-1)/length(z);
plot(abs(Z))
zc=ifft(Z.*exp(%i*f*%pi/2));
subplot(2,2,3)
plot(real(zc),imag(zc))
the result is
| | 2 | No.2 Revision |
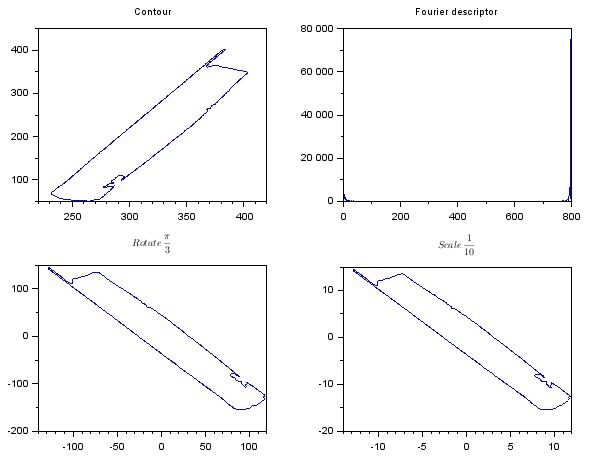
Hi,
I don't know exactely what you want to do with fourier descriptor but you must care about number of point in your contour. May be you should use first a software like matlab scilab octave.... to check your algorithm For example with scilab a small program rotating a shape :
fs=mopen('Ctr.txt',"r");
c=[];
while meof(fs)==0
    x=mfscanf(2,fs,"%d")
    c=[c x];
end
mclose(fs)
z=c(1,:)+%i*c(2,:);
Z=fft(z)
Z(1)=0;
scf(1)
clf()
subplot(2,2,1)
title('Contour')
plot(c(1,:),c(2,:))
subplot(2,2,2)
title('Fourier descriptor')
Z(1)=0;
f=(0:length(z)-1)/length(z);
plot(abs(Z))
zc=ifft(Z.*exp(%i*f*%pi/2));
zc=ifft(Z.*exp(%i*%pi/3));
subplot(2,2,3)
title("$Rotate \frac{\pi}3$');
plot(real(zc),imag(zc))
Z=Z/10;
zc=ifft(Z.*exp(%i*%pi/3));
subplot(2,2,4)
plot(real(zc),imag(zc))
title('$Scale \frac1{10}$');
the result is