I want to draw curve on control points so that I can move the curve to change the colours , below is the code , getting help from [a very well explained answer]
(http://stackoverflow.com/questions/23614037/impact-of-cubic-and-catmull-splines-on-image)
const int N=5;      // number of control points (must be >= 4)
float ctrl[N]=      // control points y values initiated with linear function y=x
{           // x value is index*1.0/(N-1)
    0.00,
    0.25,
    0.50,
    0.75,
    1.00,
 };
float correction(float col,float *ctrl,int n)
    {
    float di=1.0/float(n-1);
    int i0,i1,i2,i3;
    float t,tt,ttt;
    float a0,a1,a2,a3,d1,d2;
    // find start control point
    col*=float(n-1);
    i1=col; col-=i1;
    i0=i1-1;
    i2=i1+1; if (i2>=n) i2=n-1;
    i3=i1+2;
    // compute interpolation coefficients
    if (i0>=0) d1=0.5*(ctrl[i2]-ctrl[i0]); else d1=ctrl[i2]-ctrl[i1];
    if (i3< n) d2=0.5*(ctrl[i3]-ctrl[i1]); else d2=ctrl[i2]-ctrl[i1];
    a0=ctrl[i1];
    a1=d1;
    a2=(3.0*(ctrl[i2]-ctrl[i1]))-(2.0*d1)-d2;
    a3=d1+d2+(2.0*(-ctrl[i2]+ctrl[i1]));
    // now interpolate new colro intensity
    t=col; tt=t*t; ttt=tt*t;
    t=a0+(a1*t)+(a2*tt)+(a3*ttt);
    return t;
    }


int main (int argc, const char** argv)
{
Mat input = imread ("E:\\img2.jpg");
Mat input1 = input;
for(int i=0 ; i<input1.rows ; i++)
{
    for (int p=0;p<input1.cols;p++)
    {

        input1.at<cv::Vec3b>(i,p)[0] = 255*correction(input1.at<cv::Vec3b>(i,p)[0]/255.0,ctrl,N);  //B
        input1.at<cv::Vec3b>(i,p)[1] = 255*correction(input1.at<cv::Vec3b>(i,p)[1]/255.0,ctrl,N);  //G
        input1.at<cv::Vec3b>(i,p)[2] = 255*correction(input1.at<cv::Vec3b>(i,p)[2]/255.0,ctrl,N);  //R

    }
}

imshow("image" , input);
waitKey();
}
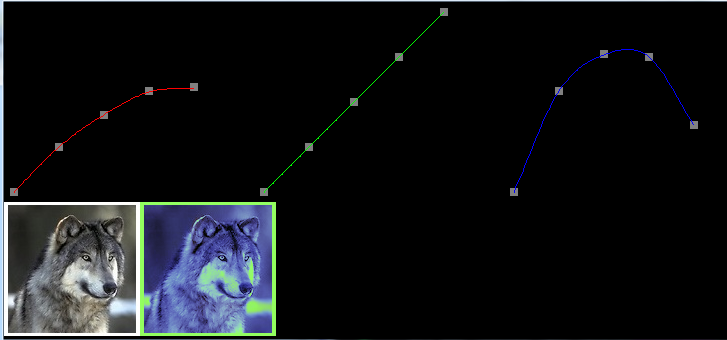
But the required output is like the curve