Ask Your Question

Revision history [back]

click to hide/show revision 1
initial version

python: how to compute the gray level histogram features as mentioned in the paper

Hi I am extracting the grey level features of image mentioned in the following paper: part 4.5 low level features:https://www.cs.cmu.edu/~yke/photoqual/cvpr06photo.pdf

We describe two low level features that are particu- larly important for photo quality assessment – contrast and brightness. Professional photos usually have higher contrast than snapshots. We measure the contrast of an image as fol- lows. First, we compute the gray level histogram Hr , Hg , and Hb for each of the red, green, and blue channels, re- spectively. Then, we compute the combined histogram H, where

image description

I can't clearly understand the above part in the paper. As my understanding about grey level features, take the above image as example. Use the opencv convert the color image to grey image. as the following code:

image = cv2.imread('lenna.png') gray = cv2.cvtColor(image, cv2.COLOR_BGR2GRAY)
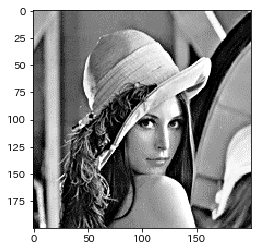
image description

and then using the following code to get the histogram with the following code:

hist = cv2.calcHist([gray], [0], None, [256], [0,255])

I want to ask, and I don't know the meaning of gray level histogram for each channel.

(1) how to we compute the gray level histogram Hr , Hg , and Hb for each of the red, green, and blue channels.

(2) how to compute the the contrast quality, qct mentioned in the paper.

click to hide/show revision 2
None

updated 2019-01-07 03:17:49 -0600

berak gravatar image

python: how to compute the gray level histogram features as mentioned in the paper

Hi I am extracting the grey level features of image mentioned in the following paper: part 4.5 low level features:https://www.cs.cmu.edu/~yke/photoqual/cvpr06photo.pdffeatures: https://www.cs.cmu.edu/~yke/photoqual/cvpr06photo.pdf

We describe two low level features that are particu- larly important for photo quality assessment – contrast and brightness. Professional photos usually have higher contrast than snapshots. We measure the contrast of an image as fol- lows. First, we compute the gray level histogram Hr , Hg , and Hb for each of the red, green, and blue channels, re- spectively. Then, we compute the combined histogram H, where

image description

I can't clearly understand the above part in the paper. As my understanding about grey level features, take the above image as example. Use the opencv convert the color image to grey image. as the following code:

image = cv2.imread('lenna.png') gray = cv2.cvtColor(image, cv2.COLOR_BGR2GRAY)

image description

and then using the following code to get the histogram with the following code:

hist = cv2.calcHist([gray], [0], None, [256], [0,255])

I want to ask, and I don't know the meaning of gray level histogram for each channel.

(1) how to we compute the gray level histogram Hr , Hg , and Hb for each of the red, green, and blue channels.

(2) how to compute the the contrast quality, qct mentioned in the paper.