I try to find the Peaks of a Histogramm which was calculated from a Orientation Image which was created through phase(). The Code I use is from this Anwser. My Problem is, that it seems, that the peaks the algorithm found are not right. (Example image at end) First the Code:
Calculating Histogram and call Peakfinder:
Mat patch = src(Rect(px,py,15,15));
Mat Sx;
Sobel(patch, Sx, CV_32F, 1, 0, 3);

Mat Sy;
Sobel(patch, Sy, CV_32F, 0, 1, 3);

Mat ori;
phase(Sx, Sy, ori, true);

Mat hist;
int nbins = 36;
int hsize[] = {nbins};
float range[] = {0, 360};
const float *ranges[] = {range};
int chnls[] = {0};
bool uniform = true; bool accumulate = false;

calcHist(&ori, 1, chnls, Mat(), hist, 1, hsize, ranges, uniform, accumulate);

vector<Point> peaks;
findHistPeaks(hist, peaks);
Here the Peak Finder Methods:
void non_maxima_suppression(const Mat& src, Mat& mask, const bool remove_plateaus){

//find pixels that are equal to the local neighborhood not maximum (including plateaus)
dilate(src, mask, Mat());
compare(src, mask, mask, CMP_GE);

//optionally filter out pixels that are equal to the local minimum ('plateaus')
if(remove_plateaus){
    Mat non_plateau_mask;
    erode(src, non_plateau_mask, Mat());
    compare(src, non_plateau_mask, non_plateau_mask, CMP_GT);
    bitwise_and(mask, non_plateau_mask, mask);
}
}

//function that finds the peaks of a given hist image
void findHistPeaks(Mat _src, OutputArray _idx, const float scale= 0.2, const Size& ksize = Size(9,9), const bool remove_plateus = true){

Mat hist = _src.clone();

// find the min and max values of the hist image
double min_val, max_val;
minMaxLoc(hist, &min_val, &max_val);

Mat mask;
GaussianBlur(hist, hist, ksize, 0); //smooth a bit in otder to obtain better result
non_maxima_suppression(hist, mask, remove_plateus);

vector<Point> maxima; // Outputs, locations of non-zero pixels
findNonZero(mask, maxima);

for(vector<Point>::iterator it = maxima.begin(); it != maxima.end();){
    Point pnt = *it;
    float pVal = hist.at<float>(/*pnt.x,*/pnt.y -1);
    float val = hist.at<float>(/*pnt.x, */ pnt.y);
    float nVal = hist.at<float>(/*pnt.x, */pnt.y+1);

    // filter peaks
    if((val > max_val * scale))
        ++it;
    else
        it = maxima.erase(it);
}

Mat(maxima).copyTo(_idx);

}
And drawing the histogram with circles to mark the Peaks:
double maxVal = 0;

minMaxLoc(hist,0,&maxVal,0,0);
int xscale=10;

Mat histImage;
histImage = Mat::zeros(226, 36 * xscale, CV_8UC1);

for(int s = 0; s < 37; s++){

    float binVal = hist.at<float>(s,0);
    int intensity = cvRound(binVal * 36/maxVal);
    rectangle(histImage, Point(s*xscale,histImage.rows), Point((s+1)*xscale-1, histImage.rows - intensity), Scalar(255, 0, 0), 1);

}
for(int i = 0; i < peaks.size(); i++){
    circle(histImage, peaks[i], 25, Scalar(255,0,0), 2, LINE_8, 0);
}

imshow("histo", histImage);
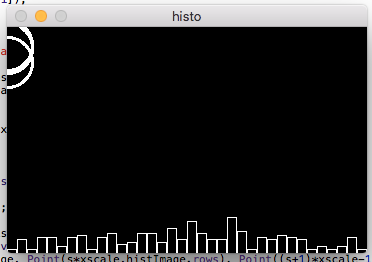
When I write the values of peak vector in the console I get this result:
[0, 18]
[0, 21]
[0, 35]
and the Histogram Image looks like this: