Ask Your Question
1

Plotting graph in opencv

asked 2016-07-08 19:33:43 -0600

davidkim gravatar image

updated 2020-09-18 05:29:34 -0600

I wonder that is there any plot function in opencv?

Somebody told me that it;s gonna pretty hard to plot in opencv

image description

This is picture what i want to plot...

I heard that there is plot function in version 3.xxx opencv.

http://www.shervinemami.info/graphs.html

above link is also containing graph library. but i have error with library direction. i'm not sure where should i have to put library...

THank you..!

edit retag flag offensive close merge delete

2 answers

Sort by ยป oldest newest most voted
1

answered 2016-07-08 21:24:43 -0600

Tetragramm gravatar image

There is a plot module in the OpenCV Contrib modules. The documentation for that is HERE.

There are no samples, and very little documentation. It seems to be pretty simple, with no labels on the grid-lines. I don't know if you can plot multiple data sets on the same graph, but if you set the min/max and plot size to the same values, you should be able to do a bitwise_xor to combine them.

Basically, it looks like you do something like this: The data must be in double format, or it calls exit(0), which is stupid, it should use CVAssert like everything else, and I think it can handle float just fine with a little work. Also, remember that +Y is down. So

Mat xData, yData, display;
Ptr<plot::Plot2d> plot;
xData.create(1, 100, CV_64F);//1 Row, 100 columns, Double
yData.create(1, 100, CV_64F);

for(int i = 0; i<100; ++i)
{
    xData.at<double>(i) = i/10.0;
    yData.at<double>(i) = SQUARE(i/10.0);
}
plot = plot::createPlot2d(xData, yData);
plot->setPlotSize(100, 1000);
plot->setMaxX(10);
plot->setMinX(0);
plot->setMaxY(100);
plot->setMinY(-1);
plot->render(display);
imshow("Plot", display);
waitKey();

produces

image description

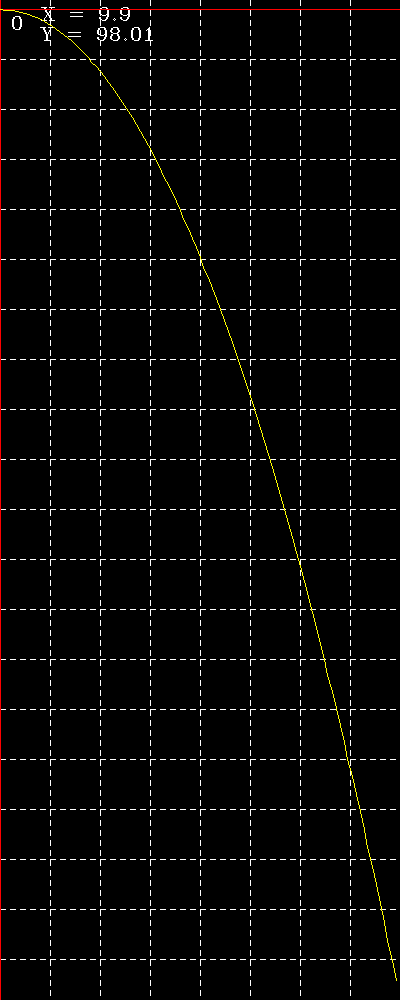
Not very intuitive. But you can draw on this image just like any other image, with text, circles, rectangles and lines.

edit flag offensive delete link more

Comments

Ptr<plot::plot2d> plot; not working for me.

Safeer_Aabbasi gravatar imageSafeer_Aabbasi ( 2017-01-29 23:51:39 -0600 )edit

Have you downloaded and compiled the opencv_contrib with teh cmake flags ?

malharjajoo gravatar imagemalharjajoo ( 2018-01-23 05:32:20 -0600 )edit
0

answered 2020-04-24 04:05:52 -0600

wpalfi gravatar image

You could try Profactor CvPlot https://github.com/Profactor/cv-plot. (I am the developer). It is very easy to integrate, purely opencv based and can be extended with custom controls. This is how you can plot to a cv::Mat or show a diagram with an interactive viewer:

#include <CvPlot/cvplot.h>
std::vector<double> x(20*1000), y1(x.size()), y2(x.size()), y3(x.size());
for (size_t i = 0; i < x.size(); i++) {
    x[i] = i * CV_2PI / x.size();
    y1[i] = std::sin(x[i]);
    y2[i] = y1[i] * std::sin(x[i]*50);
    y3[i] = y2[i] * std::sin(x[i]*500);
}
auto axes = CvPlot::makePlotAxes();
axes.create<CvPlot::Series>(x, y3, "-g");
axes.create<CvPlot::Series>(x, y2, "-b");
axes.create<CvPlot::Series>(x, y1, "-r");

//plot to a cv::Mat
cv::Mat mat = axes.render(300, 400);

//or show with interactive viewer
CvPlot::show("mywindow", axes);

image description

You may also want to try Leonardvandriel's cvplot. It works similar but cannot be extended with custom drawables.

edit flag offensive delete link more

Question Tools

1 follower

Stats

Asked: 2016-07-08 19:33:43 -0600

Seen: 11,816 times

Last updated: Jul 08 '16