OpenCV dft audio getting spectrogram
I have a audio sequence that was captured with my microphone. This sequence is represented in a cv::Mat object with 1 row and n columns, where n represents the number of samples (=length) of my audio file. I want to get the frequency spectrogram using Discrete Fourier Transform in OpenCV. I tried to make some example codes work, but I do not get the image I want to get.
Edit
This is the input image (the sound visualized as Mat for OpenCV):
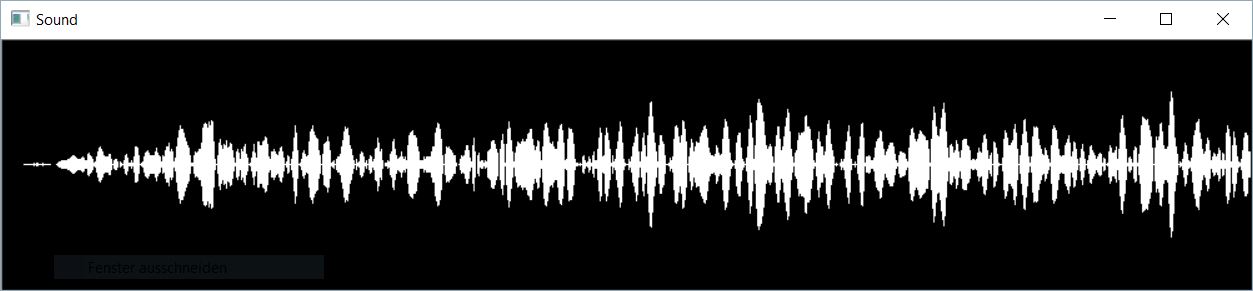
I read each 20 samples (20 pixels in x-direction) and multiply it with a hanning-window-function. Than I do the discrete fourier transform (dft) and get for each 20-sample-window the dft's result:
e.g.:
 .
.
How can I get by multiple of theses images a spectrogram?
Thanks!
You can read this post