Locate Peaks in Orientation Histogramm
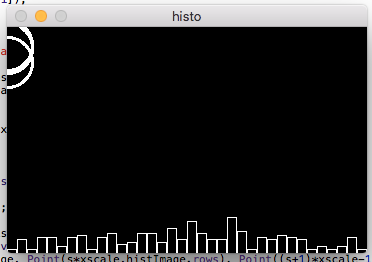
I try to find the Peaks of a Histogramm which was calculated from a Orientation Image which was created through phase(). The Code I use is from this Anwser. Instead of counting every possible Angle I round them and just count every tenth step. (e.g. 11 = 1, 345 = 35 etc.) My Problem is, that it seems, that the peaks the algorithm found are not right. (Example image at end) First the Code:
Calculating Histogram and call Peakfinder:
Mat patch = src(Rect(px,py,15,15));
Mat Sx;
Sobel(patch, Sx, CV_32F, 1, 0, 3);

Mat Sy;
Sobel(patch, Sy, CV_32F, 0, 1, 3);

Mat ori;
phase(Sx, Sy, ori, true);

Mat hist;
int nbins = 36;
int hsize[] = {nbins};
float range[] = {0, 360};
const float *ranges[] = {range};
int chnls[] = {0};
bool uniform = true; bool accumulate = false;

calcHist(&ori, 1, chnls, Mat(), hist, 1, hsize, ranges, uniform, accumulate);

vector<Point> peaks;
findHistPeaks(hist, peaks);
Here the Peak Finder Methods:
void non_maxima_suppression(const Mat& src, Mat& mask, const bool remove_plateaus){

//find pixels that are equal to the local neighborhood not maximum (including plateaus)
dilate(src, mask, Mat());
compare(src, mask, mask, CMP_GE);

//optionally filter out pixels that are equal to the local minimum ('plateaus')
if(remove_plateaus){
    Mat non_plateau_mask;
    erode(src, non_plateau_mask, Mat());
    compare(src, non_plateau_mask, non_plateau_mask, CMP_GT);
    bitwise_and(mask, non_plateau_mask, mask);
}
}

//function that finds the peaks of a given hist image
void findHistPeaks(Mat _src, OutputArray _idx, const float scale= 0.2, const Size& ksize = Size(9,9), const bool remove_plateus = true){

Mat hist = _src.clone();

// find the min and max values of the hist image
double min_val, max_val;
minMaxLoc(hist, &min_val, &max_val);

Mat mask;
GaussianBlur(hist, hist, ksize, 0); //smooth a bit in otder to obtain better result
non_maxima_suppression(hist, mask, remove_plateus);

vector<Point> maxima; // Outputs, locations of non-zero pixels
findNonZero(mask, maxima);

for(vector<Point>::iterator it = maxima.begin(); it != maxima.end();){
    Point pnt = *it;
    float pVal = hist.at<float>(/*pnt.x,*/pnt.y -1);
    float val = hist.at<float>(/*pnt.x, */ pnt.y);
    float nVal = hist.at<float>(/*pnt.x, */pnt.y+1);

    // filter peaks
    if((val > max_val * scale))
        ++it;
    else
        it = maxima.erase(it);
}

Mat(maxima).copyTo(_idx);

}
And drawing the histogram with circles to mark the Peaks:
double maxVal = 0;

minMaxLoc(hist,0,&maxVal,0,0);
int xscale=10;

Mat histImage;
histImage = Mat::zeros(226, 36 * xscale, CV_8UC1);

for(int s = 0; s < 37; s++){

    float binVal = hist.at<float>(s,0);
    int intensity = cvRound(binVal * 36/maxVal);
    rectangle(histImage, Point(s*xscale,histImage.rows), Point((s+1)*xscale-1, histImage.rows - intensity), Scalar(255, 0, 0), 1);

}
for(int i = 0; i < peaks.size(); i++){
    circle(histImage, peaks[i], 25, Scalar(255,0,0), 2, LINE_8, 0);
}

imshow("histo", histImage);
When I write the values of peak vector in the console I get this result:
[0, 18]
[0, 21]
[0, 35]
and the Histogram Image looks like this:


Thank you for mentioning other Questions I already read... I you would have read my Question you would have seen, that I'm referring to the last one. I don't think that either of them would help me to slove my solution.
peaks are basically either global or either local. If you want a global one, just look for the bin value and retrieve its index. If you want local peaks, you needs to look for values that are higher then the values in the range [value-x, value+x], where x defines how big your local regions are :)