Ask Your Question
1

Visually anayzing network diagrams.

asked 2016-09-05 13:20:26 -0600

interstar gravatar image

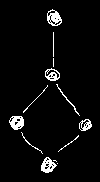
I'm trying to build a system which can recognise simple networks of connected nodes from hand drawings

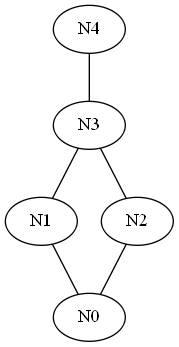
eg. Simple network

I'm particularly interested in getting the edges between the nodes. But I'm finding it surprisingly difficult to get a good analysis. My processing pipeline is currently like this :

  • blur the image
  • invert
  • adaptive gaussian threshold
  • look for contours
  • find bounding ellipses for contours
  • filter to get just contours whose major axis is more than 3 or 4 times the minor axis, and whose overall size is larger than average (I'm guessing these match the edges rather than the nodes)
  • find the foci of these ellipses (to get the end points of the edges)

The results really aren't good. Some edges still aren't picked up. The contours tend to pick up much too much detail eg. I might get a couple of parallel contours for the same edge. The bounding ellipse is often bigger than the contours and the foci aren't at the ends of the lines.

So ... am I approaching this all wrong? Is there a better family of algorithms for extracting this kind of information? Does anyone know of good research on this problem?

cheers

Phil

edit retag flag offensive close merge delete

Comments

Ow wait, some pointers

  • adaptive gaussian threshold please forget this. Go for a simple binary OTSU thresholding. There is a clear difference between the color of the background and the color of the writings so it should go fairly easy.
  • Your contours will then be much better.
  • You can then collect moments to differ between nodes and links.
  • Some reasoning must be written then to walk through the nodes.
StevenPuttemans gravatar imageStevenPuttemans ( 2016-09-09 06:48:40 -0600 )edit
1

You can't use OTSU threshold here. OTSU minimizes the intra-class variance... in binary thresholding it uses just 2 classes. Here background histogram is so spread due to non uniform illumination and the tenuous foreground signal is lost within 2 main classes. More simply, take a look at grayscale histogram... there aren't 2 peaks (class) for fg and bk that's why OTSU can't works

this is coming in my mind ;-)

pklab gravatar imagepklab ( 2016-09-09 10:40:41 -0600 )edit

2 answers

Sort by ยป oldest newest most voted
7

answered 2016-09-09 07:03:08 -0600

pklab gravatar image

updated 2016-09-09 10:51:22 -0600

I would suggest to do better preprocessing because of non uniform background and to avoid blur because thin arcs can disappear. When you have a good mask for your drawing you can use massive morphology operation to isolate nodes and arcs Finally you have to design a logic to build the chart connections.

edit: small changes in descriptions

Below is my DiagramAnalyzer to convert your image into a Graphviz/dot chart. Here is the result

graph G{ 
    N0 N1 N2 N3 N4 
    N1 -- N0
    N2 -- N0
    N3 -- N2
    N3 -- N1
    N4 -- N3
}

Enumerating: image description Layout by Graphviz/dot image description
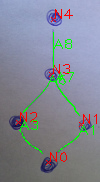
int DiagramAnalyzer()
{
    Mat src, bw;
    src = imread("../img/diagram-x5.jpg");

==PREPROCESSING==

Option1: Remove non uniform background/illumination. You can achieve this using the wonderful quadratic background removal by @LBerger. Than get a mask of the drawing using a simple threshold

#if 1
    Mat srcGray, dstGray;
    cvtColor(src, srcGray, CV_BGR2GRAY);
    BackgroundRemoveQuadratic(srcGray, dstGray);
    threshold(dstGray, bw, 100, 255, THRESH_OTSU);

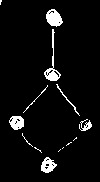
Quadratic result Quadratic result threshold image description
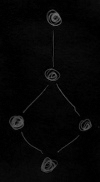
OR Option2: Get the HSV planes and threshold high values in S (>=95 percentile) to get a mask of the drawing. You can achieve this using clipHistPercent=5 with BrightnessAndContrastAuto than get a binary mask looking at very high values in saturation

#else
    Mat src_hsv, saturation;
    vector<cv::Mat> hsv_planes;
    cvtColor(src, src_hsv, CV_BGR2HSV);
    cv::split(src_hsv, hsv_planes);
    saturation = hsv_planes[1];
    BrightnessAndContrastAuto(saturation, saturation, 5);
    bw = saturation >= 254;
#endif

Saturation result (look at values of drawing) BrightnessAndContrastAuto threshold image description
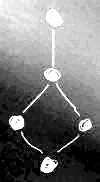
fill circular structures using small circle

int nodeSize = 15; //avg node diameter in px
Morph(bw, bw, MORPH_CLOSE, MORPH_ELLIPSE, cvRound(nodeSize / 5));
imshow("Preprocessing", bw);
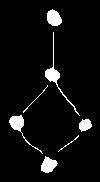
image description Preprocessing (result of quadratic)

GET MASK OF NODES: remove boundary structures smaller than nodeSize . Should remove the arcs

cv::Mat nodesMask;
Morph(bw, nodesMask, MORPH_OPEN, MORPH_ELLIPSE, cvRound(nodeSize / 5));
imshow("Nodes-Mask", nodesMask);
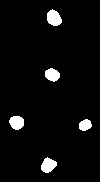
Node Mask Node Mask

GET MASK OF ARCS: dilate nodes a bit (ensure node vs arcs separation) than subtract them from the global mask

cv::Mat arcs, nodesLarger;
Morph(nodesMask, nodesLarger, MORPH_DILATE, MORPH_ELLIPSE, 1);
arcs = bw - nodesLarger;
imshow("Arcs-Mask", arcs);
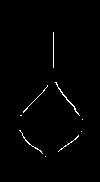
Arcs Mask Arcs Mask

GET INTERSECTIONS: ensure node vs arcs intersection doubling size of nodes than get a mask of shared pixels

cv::Mat intersections;
Morph(nodesLarger, nodesLarger, MORPH_DILATE, MORPH_ELLIPSE, nodeSize);
intersections = nodesLarger & arcs;

GET CONTOURS OF ELEMENTS

vector<vector<Point> > nodesContours, arcsContours, intesectsContours;
findContours(nodesLarger, nodesContours, CV_RETR_EXTERNAL, CHAIN_APPROX_SIMPLE);
findContours(arcs, arcsContours, CV_RETR_EXTERNAL, CHAIN_APPROX_SIMPLE);
findContours(intersections, intesectsContours, CV_RETR_EXTERNAL, CHAIN_APPROX_SIMPLE);
vector<Point> nodesCenter(nodesContours.size(), Point(-1, -1));
vector<double> nodesArea(nodesContours.size(), -1);
vector<double> arcsLenght(arcsContours.size(), -1);

DRAW ENUMERATED CONTOURS and get center of nodes

Moments m;
Point center;
Scalar cl = Scalar(0, 0, 255);
double val,minvalue = nodeSize/3;
for (size_t i = 0; i < nodesContours.size(); i++)
{
    val = contourArea(nodesContours[i]);
    if (val < minvalue) continue; //skip if it's small
    nodesArea[i] = val;
    m = moments(nodesContours[i], true);
    //if (m.m00 == 0) continue;
    center = Point(m.m10 / m.m00, m.m01 / m.m00);
    nodesCenter[i] = center;
    drawMarker(src, center, cl, MARKER_TILTED_CROSS, 5);
    putText(src, "N" + to_string(i), center, FONT_HERSHEY_PLAIN, 1, cl);
}
cl = Scalar(0, 255, 0);
minvalue = nodeSize/5 ...
(more)
edit flag offensive delete link more

Comments

1

Hi pklab.

Wow! Thank you so much. That is a fantastically comprehensive answer.

I'll need to dive in to grok it fully (and I'll be trying to translate it into Python) but it's amazing.

Where I'm eventually going with this is I have a simple data-flow programming language (connecting processing nodes via queues) that I want to turn the diagrams directly into. I'll keep you posted on the updates of when this will be available (it will all be on GitHub.) The language is written in Clojure, but I'm prototyping the OpenCV analysis in Python at the moment.

Many many thanks again.

Phil

interstar gravatar imageinterstar ( 2016-09-09 10:57:26 -0600 )edit
1

Nice to see your congrats :). BTW most of work is done by good preprocessing. Be aware with searching lines because human might draw any curve. Finally take care of distance between end of arc and node. Let us to know of your progress !

pklab gravatar imagepklab ( 2016-09-09 12:10:48 -0600 )edit
1

nice work @pklab, well done ;-)

theodore gravatar imagetheodore ( 2016-09-10 03:48:33 -0600 )edit

nice explanation with details... I have also used the similar method in Pytthon and got nodes edges separately in flow diagram. Further, can somebody help to find the relation of node and edges i.e in degree and out-degree of node or in other words, predecessor and successor of node connected with edge. The issue i am facing: while masking the interaction point is removed so not giving the intersection point of node-edge. Any help will be appritiated

LC gravatar imageLC ( 2017-01-17 03:16:28 -0600 )edit

@LC sorry but I can't fully understand your question. BTW (1)my algorithm returns the graph as node to node relation shown at top of my answer. You can start from there using common graph theory algorithm to performs wanted analysis. (2) Can't you get all INTERSECTIONS ? ... play around morph masks size

pklab gravatar imagepklab ( 2017-01-17 03:54:45 -0600 )edit

yes I think, I will try this using python. thanks

LC gravatar imageLC ( 2017-01-17 03:58:15 -0600 )edit

Actually I have lost all intersection points when masking for nodes, so did not get the intersection points. I will check again your sol and find the way to get intersection points

LC gravatar imageLC ( 2017-01-17 04:01:00 -0600 )edit
2

answered 2016-09-05 19:53:02 -0600

Tetragramm gravatar image

There are a couple of ways to do this in OpenCV. All have different strengths.

One is contours. You've already tried this, and found the problems. On the plus side, it's pretty fast and usually very accurate.

Second is HoughLinesP. This uses the Hough transform to find lines in the image. It takes a canny edge detected image as input, and outputs a set of lines. It's slower than most everything else, and has problems with angular resolution. In your case, with one image, and only a few typical angles, this should be great.

Third is the Line Segment Detector. I haven't used this too much, so I'm not quite sure of the tradeoffs. It is much faster than HoughLines, but not as fast (I think) as contours. I'm also not sure how to use it. You'd have to look at the samples. It might actually be more accurate than the others though.

edit flag offensive delete link more

Comments

Thanks. I'll take a look

interstar gravatar imageinterstar ( 2016-09-06 10:07:45 -0600 )edit

Pls share code in Python if written.

LC gravatar imageLC ( 2020-05-25 12:06:17 -0600 )edit

Question Tools

1 follower

Stats

Asked: 2016-09-05 13:20:26 -0600

Seen: 1,382 times

Last updated: Sep 09 '16