This forum is disabled, please visit https://forum.opencv.org
| | 1 | initial version |
You can smooth your histogram to catch only 2 major peaks
cv::Mat hist,hist_smoothed;
int smooth_size=5; //use odd value
calcHist(&grayImg, 1, 0, cv::Mat(), hist, 1, &histSize, &histRange, uniform, accumulate);
GaussianBlur(hist, hist_smoothed, Size(smooth_size, smooth_size), 0, 0, BORDER_CONSTANT);
than you can use your loop
int number=0;
int size=0;
for (int i=1; i<256-1;++i)  {
    if(hist[i]>hist[i-1] && hist[i]>hist[i+1]) {
        cout << "Peak Index: " <<i << " Peak Value: " <<hist[i] <<endl;
    }
}
in case you can play with smooth_size for better filtering.
See my post here
PS: please use '0101' button when you type some code
| | 2 | No.2 Revision |
You can smooth your histogram to catch only 2 major peaks
cv::Mat hist,hist_smoothed;
int smooth_size=5; //use odd value
calcHist(&grayImg, 1, 0, cv::Mat(), hist, 1, &histSize, &histRange, uniform, accumulate);
GaussianBlur(hist, hist_smoothed, Size(smooth_size, smooth_size), 0, 0, BORDER_CONSTANT);
than you can use your loop
int number=0;
int size=0;
for (int i=1; i<256-1;++i)  {
    if(hist[i]>hist[i-1] if( hist_smoothed[i]> hist_smoothed[i-1] && hist[i]>hist[i+1])  hist_smoothed[i]> hist_smoothed[i+1]) {
        cout << "Peak Index: " <<i << " Peak Value: " <<hist[i] <<endl;
    }
}
in NOTE: you should know that hist_smoothed[i] < hist[i] because of smoothing.
In case you can play with smooth_size for better filtering.
See also my post here
PS: please use '0101' button when you type some code
| | 3 | No.3 Revision |
You can smooth your histogram to catch only 2 major peaks
cv::Mat hist,hist_smoothed;
int smooth_size=5; //use odd value
calcHist(&grayImg, 1, 0, cv::Mat(), hist, 1, &histSize, &histRange, uniform, accumulate);
int smooth_size=5; //use odd value
GaussianBlur(hist, hist_smoothed, Size(smooth_size, smooth_size), 0, 0, BORDER_CONSTANT);
than you can use your loop
int number=0;
int size=0;
for (int i=1; i<256-1;++i)  {
    if( hist_smoothed[i]> hist_smoothed[i-1] &&  hist_smoothed[i]> hist_smoothed[i+1]) {
        cout << "Peak Index: " <<i << " Peak Value: " <<hist[i] <<endl;
    }
}
NOTE: you should know that hist_smoothed[i] < hist[i] because of smoothing.
In case you can play with smooth_size for better filtering.
See also my post here
PS: please use '0101' '1010' button when you type some code
| | 4 | No.4 Revision |
You can smooth your histogram the histogram to catch only 2 major peaks with:
cv::Mat hist,hist_smoothed;
GaussianBlur(hist, histSmoothed, Size(11,11), 0, 0, BORDER_REPLICATE);
This operation removes noise and small variation over histogram... as is expected by GaussianBlur.
You can play with the code below to analyse your histogram and make blur on it. Here is my result:
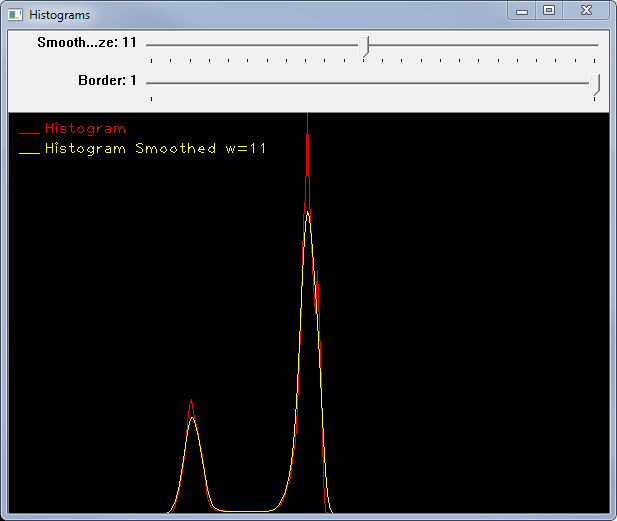
All relevant peaks are kept according to smoothing size. Look at this example
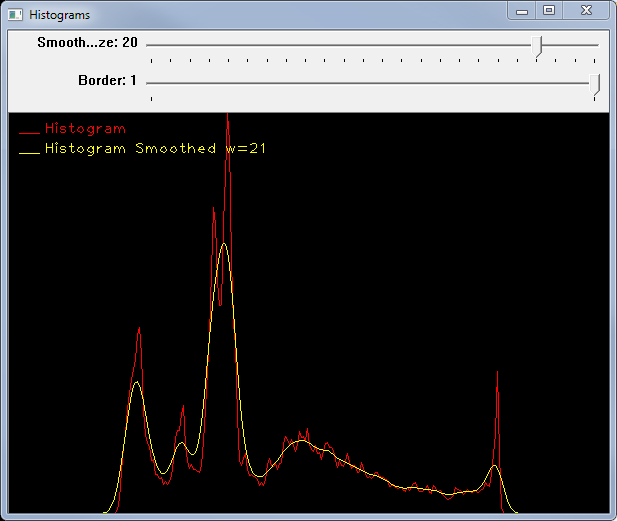
BTW, to use your algorithm for peak detection you have to be sure that the histogram is bimodal. Otherwise you have to use a more complicated peak detection, for example you should measure the power of the peak or at least it's width. Use tag peaks on this site to locate examples like this
This is the code for smoothing and plot.... enjoy !
#define CL_RED  Scalar(0,0,255)
#define CL_BLU  Scalar(255,0,0)
#define CL_YELLOW  Scalar(0,255,255)

struct histSerie {
    Mat hist;
    std::string Title;
    Scalar lineColor;
    int lineWidth;
    histSerie(std::string _Title = "", Mat _hist = Mat(),
        Scalar _lineColor = Scalar(255, 0, 0), int _lineWidth = 2) :
        Title(_Title), lineColor(_lineColor), lineWidth(_lineWidth)
    {_hist.copyTo(hist);}
};

int smoothSize = 11;
int borderType = BORDER_REPLICATE;
std::string winName = "Histograms";
Mat grayImg;

//helper function
void PlotHistSeries(const vector<histSerie> &histSeries, Mat &plotResult, Scalar bgColor = Scalar(0, 0, 0));

void onTrackBar(int, void*)
{
    Mat hist, histSmoothed, plotResult;
    vector<histSerie> histSeries;
    //enable this is you want to draw over srcImage
    //cvtColor(grayImg, plotResult, CV_GRAY2BGR);

    // Create the histogram
    int histSize = 256;
    float range[] = { 0, histSize };
    const float* histRange = { range };
    calcHist(&grayImg, 1, 0, cv::Mat(), Mat(), hist, 1, &histSize, &histRange, uniform, accumulate);
int smooth_size=5; true, false);
    histSeries.push_back(histSerie("Histogram", hist, CL_RED, 1));

    // smooth the histogram
    if ((smoothSize % 2) == 0)
        smoothSize += 1;  //use odd value
    Size sz(smoothSize, smoothSize);
    GaussianBlur(hist, hist_smoothed, Size(smooth_size, smooth_size), histSmoothed, sz, 0, 0, BORDER_CONSTANT);
than you can use your loop
borderType);

    histSeries.push_back(histSerie("Histogram Smoothed w="+to_string(smoothSize),
        histSmoothed, CL_YELLOW, 1));

    PlotHistSeries(histSeries, plotResult);
    imshow(winName, plotResult);
}

int main(int argc, char* argv[])
{
    Mat src;
    src = imread("../img/grayscale2.jpg");
    if (!src.data) return -1;
    cvtColor(src, grayImg, CV_BGR2GRAY);
    imshow("Src image", grayImg);
    namedWindow(winName);
    createTrackbar("Smooth Size", winName, &smoothSize, 23, onTrackBar);
    createTrackbar("Border", winName, &borderType, BORDER_REPLICATE, onTrackBar);
    onTrackBar(0, 0);

    waitKey(0);
    return 0;
}
void PlotHistSeries(const vector<histSerie> &histSeries, Mat &plotResult, Scalar bgColor)
{
    //create the plot image
    int hist_w = 600; int hist_h = 400;
    if (plotResult.empty())
        plotResult = Mat(hist_h, hist_w, CV_8UC3, bgColor);
    else {
        hist_w = plotResult.cols; int hist_h = plotResult.rows;
    }

    //calculate y scale
    double maxOfMax = 0;
    int histSize = 0;
    for (int i=1; i<256-1;++i)  s = 0; s < histSeries.size(); s++) {
    if( hist_smoothed[i]> hist_smoothed[i-1] &&  hist_smoothed[i]> hist_smoothed[i+1]) {
        cout << "Peak Index: " <<i << " Peak Value: " <<hist[i] <<endl;
    histSize = max(histSize, histSeries[s].hist.size().height);
        double minVal, maxVal;
        minMaxLoc(histSeries[s].hist, &minVal, &maxVal);
        maxOfMax = max(maxOfMax, maxVal);
    }
    double yScale = hist_h / maxOfMax;
    // Draw the histograms
    int bin_w = cvRound((double)hist_w / histSize);
    for (int s = 0; s < histSeries.size(); s++) {
        Mat data;
        histSeries[s].hist.convertTo(data, CV_64F, yScale, 0);
        Point pt1, pt2;

        for (int i = 1; i < histSize; i++) {
            pt1 = Point(bin_w*(i - 1), cvRound(hist_h - data.at<double>(i - 1)));
            pt2 = Point(bin_w*(i), cvRound(hist_h - data.at<double>(i)));
            line(plotResult, pt1, pt2, histSeries[s].lineColor, histSeries[s].lineWidth, 8, 0);
        }
        //the legend
        pt1.x = 10; pt2.x = pt1.x + 20;
        pt1.y = pt2.y = 20 * (s + 1);
        line(plotResult, pt1, pt2, histSeries[s].lineColor, histSeries[s].lineWidth, 8, 0);
        pt2.x += 5;
        cv::putText(plotResult, histSeries[s].Title, pt2,
                    CV_FONT_HERSHEY_PLAIN, 1, histSeries[s].lineColor);
    }
}
NOTE: you should know that hist_smoothed[i] < hist[i] because of smoothing.
In case you can play with smooth_size for better filtering.
See also my post here
PS: please use '1010' button when you type some code
| | 5 | No.5 Revision |
You can smooth the histogram to catch only major peaks with:
GaussianBlur(hist, histSmoothed, Size(11,11), 0, 0, BORDER_REPLICATE);
This operation removes noise and small variation over histogram... as is expected by GaussianBlur.
You can play with the code below to analyse your histogram and make blur on it. Here is my result:
All relevant peaks are kept according to smoothing size. Look at this example
BTW, to use your algorithm for peak detection you have to be sure that the histogram is bimodal. Otherwise you have to use a more complicated peak detection, for example you should measure the power of the peak or at least it's width. Use tag peaks on this site to locate examples like this
This is the code for smoothing and plot.... enjoy !
#define CL_RED  Scalar(0,0,255)
#define CL_BLU  Scalar(255,0,0)
#define CL_YELLOW  Scalar(0,255,255)

struct histSerie {
    Mat hist;
    std::string Title;
    Scalar lineColor;
    int lineWidth;
    histSerie(std::string _Title = "", Mat _hist = Mat(),
        Scalar _lineColor = Scalar(255, 0, 0), int _lineWidth = 2) :
        Title(_Title), lineColor(_lineColor), lineWidth(_lineWidth)
    {_hist.copyTo(hist);}
};

int smoothSize = 11;
int borderType = BORDER_REPLICATE;
std::string winName = "Histograms";
Mat grayImg;

//helper function
void PlotHistSeries(const vector<histSerie> &histSeries, Mat &plotResult, Scalar bgColor = Scalar(0, 0, 0));

void onTrackBar(int, void*)
{
    Mat hist, histSmoothed, plotResult;
    vector<histSerie> histSeries;
    //enable this is if you want to draw over srcImage
    //cvtColor(grayImg, plotResult, CV_GRAY2BGR);

    // Create the histogram
    int histSize = 256;
    float range[] = { 0, histSize };
    const float* histRange = { range };
    calcHist(&grayImg, 1, 0, Mat(), hist, 1, &histSize, &histRange, true, false);
    histSeries.push_back(histSerie("Histogram", hist, CL_RED, 1));

    // smooth the histogram
    if ((smoothSize % 2) == 0)
        smoothSize += 1;  //use odd value
    Size sz(smoothSize, smoothSize);
    GaussianBlur(hist, histSmoothed, sz, 0, 0, borderType);

    histSeries.push_back(histSerie("Histogram Smoothed w="+to_string(smoothSize),
        histSmoothed, CL_YELLOW, 1));

    PlotHistSeries(histSeries, plotResult);
    imshow(winName, plotResult);
}

int main(int argc, char* argv[])
{
    Mat src;
    src = imread("../img/grayscale2.jpg");
imread("grayscale.jpg");
    if (!src.data) return -1;
    cvtColor(src, grayImg, CV_BGR2GRAY);
    imshow("Src image", grayImg);
    namedWindow(winName);
    createTrackbar("Smooth Size", winName, &smoothSize, 23, onTrackBar);
    createTrackbar("Border", winName, &borderType, BORDER_REPLICATE, onTrackBar);
    onTrackBar(0, 0);

    waitKey(0);
    return 0;
}
void PlotHistSeries(const vector<histSerie> &histSeries, Mat &plotResult, Scalar bgColor)
{
    //create the plot image
    int hist_w = 600; int hist_h = 400;
    if (plotResult.empty())
        plotResult = Mat(hist_h, hist_w, CV_8UC3, bgColor);
    else {
        hist_w = plotResult.cols; int hist_h = plotResult.rows;
    }

    //calculate y scale
    double maxOfMax = 0;
    int histSize = 0;
    for (int s = 0; s < histSeries.size(); s++) {
        histSize = max(histSize, histSeries[s].hist.size().height);
        double minVal, maxVal;
        minMaxLoc(histSeries[s].hist, &minVal, &maxVal);
        maxOfMax = max(maxOfMax, maxVal);
    }
    double yScale = hist_h / maxOfMax;
    // Draw the histograms
    int bin_w = cvRound((double)hist_w / histSize);
    for (int s = 0; s < histSeries.size(); s++) {
        Mat data;
        histSeries[s].hist.convertTo(data, CV_64F, yScale, 0);
        Point pt1, pt2;

        for (int i = 1; i < histSize; i++) {
            pt1 = Point(bin_w*(i - 1), cvRound(hist_h - data.at<double>(i - 1)));
            pt2 = Point(bin_w*(i), cvRound(hist_h - data.at<double>(i)));
            line(plotResult, pt1, pt2, histSeries[s].lineColor, histSeries[s].lineWidth, 8, 0);
        }
        //the legend
        pt1.x = 10; pt2.x = pt1.x + 20;
        pt1.y = pt2.y = 20 * (s + 1);
        line(plotResult, pt1, pt2, histSeries[s].lineColor, histSeries[s].lineWidth, 8, 0);
        pt2.x += 5;
        cv::putText(plotResult, histSeries[s].Title, pt2,
                    CV_FONT_HERSHEY_PLAIN, 1, histSeries[s].lineColor);
    }
}
| | 6 | No.6 Revision |
You can smooth the histogram to catch only major peaks with:peaks
GaussianBlur(hist, histSmoothed, Size(11,11), Size(9,9), 0, 0, BORDER_REPLICATE);
This operation removes noise and small variation over histogram... as is expected by GaussianBlur.
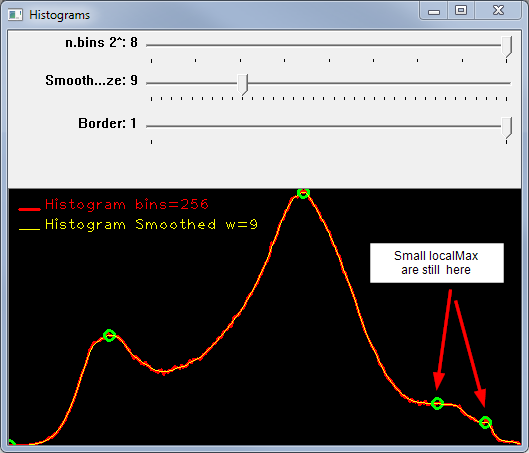
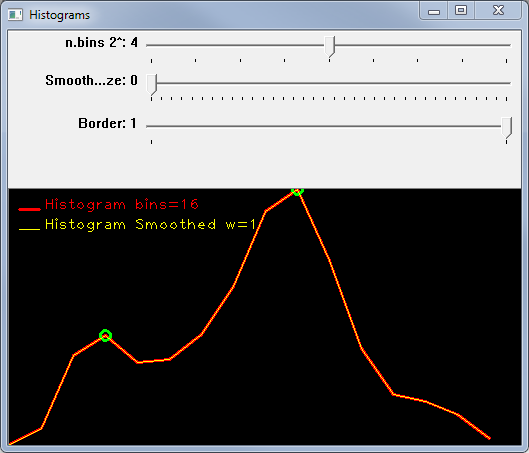
You can also reduce the num of bins to achieve similar result.
You can play with the code below to analyse your histogram and make blur on it. histogram. Here is my result:result smoothSize=9
 ]
]
All relevant peaks are kept according to smoothing smooth size. Look at You can reduce smalls localMax increasing smoothSize=17 or reduce the num of bins... this examplecase uses 16 bins
BTW, to use your algorithm for peak peaks detection you have to be sure that the histogram is bimodal. Otherwise you have to use a more complicated peak detection, for example you should measure the power of the peak or at least it's its width. Use tag peaks on this site to locate examples like this
This is the code for smoothing numBins and plot.... enjoy !
#define CL_RED  Scalar(0,0,255)
#define CL_BLU  Scalar(255,0,0)
CL_GREEN Scalar(0,255,0)
#define CL_YELLOW  Scalar(0,255,255)

Scalar(0,255,255    )

int smoothSize = 7;
int numBins = 8;
int borderType = BORDER_REPLICATE;
std::string winName = "Histograms";
Mat grayImg;

//HELPER FUNCTIONS
struct histSerie {
    Mat hist;
    std::string Title;
    Scalar lineColor;
    int lineWidth;
    bool drawLocalMax;
    histSerie(std::string _Title = "", Mat _hist = Mat(),
        Scalar _lineColor = Scalar(255, 0, 0), bool _drawLocalMax = false, int _lineWidth = 2) 1) :
        Title(_Title), lineColor(_lineColor), lineWidth(_lineWidth)
    {_hist.copyTo(hist);}
lineWidth(_lineWidth),
        drawLocalMax(_drawLocalMax)  {_hist.copyTo(hist); }
};

int smoothSize = 11;
int borderType = BORDER_REPLICATE;
std::string winName = "Histograms";
Mat grayImg;

//helper function
void PlotHistSeries(const vector<histSerie> &histSeries, Mat &plotResult, &plotResult,
    Scalar bgColor = Scalar(0, 0, 0));
void onTrackBar(int, void*);
// MAIN
int main(int argc, char* argv[])
{
    Mat src;
    src = imread("stones.jpg");
    if (!src.data) return -1;
    cvtColor(src, grayImg, CV_BGR2GRAY);
    imshow("Src image", grayImg);
    namedWindow(winName);
    createTrackbar("n.bins 2^", winName, &numBins, 8, onTrackBar);
    createTrackbar("Smooth Size", winName, &smoothSize, 35, onTrackBar);
    createTrackbar("Border", winName, &borderType, BORDER_REPLICATE, onTrackBar);
    onTrackBar(0, 0);
    waitKey(0);
    return 0;
}

void onTrackBar(int, void*)
{
    Mat hist, histSmoothed, plotResult;
    vector<histSerie> histSeries;
    //enable this if you want to draw over srcImage
    //cvtColor(grayImg, plotResult, CV_GRAY2BGR);

    // Create //Create the histogram
    int histSize = 256;
    float range[] = { 0, histSize 256 };
    const float* histRange = { range };
    int histSize = pow(2, numBins);
    calcHist(&grayImg, 1, 0, Mat(), hist, 1, &histSize, &histRange, true, false);
    histSeries.push_back(histSerie("Histogram", histSeries.push_back(histSerie("Histogram bins=" + to_string(histSize),
            hist, CL_RED, 1));

    // smooth false, 2));

    //smooth the histogram
    if ((smoothSize % 2) == 0)
        0) smoothSize += 1;  //use odd value
    Size sz(smoothSize, smoothSize);
    GaussianBlur(hist, histSmoothed, sz, 0, 0, borderType);
     histSeries.push_back(histSerie("Histogram Smoothed w="+to_string(smoothSize),
w=" + to_string(smoothSize),
        histSmoothed, CL_YELLOW, 1));

true));
    //Plot and show the result
    PlotHistSeries(histSeries, plotResult);
    imshow(winName, plotResult);
}

int main(int argc, char* argv[])
{
    Mat src;
    src = imread("grayscale.jpg");
    if (!src.data) return -1;
    cvtColor(src, grayImg, CV_BGR2GRAY);
    imshow("Src image", grayImg);
    namedWindow(winName);
    createTrackbar("Smooth Size", winName, &smoothSize, 23, onTrackBar);
    createTrackbar("Border", winName, &borderType, BORDER_REPLICATE, onTrackBar);
    onTrackBar(0, 0);

    waitKey(0);
    return 0;
}
void PlotHistSeries(const vector<histSerie> &histSeries, Mat &plotResult, Scalar bgColor)
{
    //create the plot image
    int hist_w = 600; int hist_h = 400;
    if (plotResult.empty())
        plotResult = Mat(hist_h, hist_w, CV_8UC3, bgColor);
    else {
        hist_w = plotResult.cols; int hist_h = plotResult.rows;
    }

    //calculate y scale
    double maxOfMax = 0;
    int histSize = 0;
    for (int s = 0; s < histSeries.size(); s++) {
        histSize = max(histSize, histSeries[s].hist.size().height);
        double minVal, maxVal;
        minMaxLoc(histSeries[s].hist, &minVal, &maxVal);
        maxOfMax = max(maxOfMax, maxVal);
    }
    //create the plot image
    if (plotResult.empty())
        plotResult = Mat(256, 512, CV_8UC3, bgColor);
    //calculate y scale
    double yScale = hist_h (double)plotResult.size().height / maxOfMax;
    double xScale = (double)plotResult.size().width / histSize;
    // Draw the all histograms
    int bin_w = cvRound((double)hist_w / histSize);
    for (int s = 0; s < histSeries.size(); s++) {
        Mat data;
        histSeries[s].hist.convertTo(data, CV_64F, yScale, 0);
data = histSeries[s].hist;
        Point pt1, pt2;

pt0, pt1;
        int x0, x1, y0, y1;
        float v0, v1, v2;
        // for each bins
        for (int i = 1; 0; i < histSize; i++) {
            v1 = data.at<float>(i);
            if (i == 0) v0 = v1;
            else v0 = data.at<float>(i-1);
            x0 = cvRound((i - 1) * xScale);
            x1 = cvRound(i * xScale);
            y0 = cvRound(plotResult.size().height - v0*yScale);
            y1 = cvRound(plotResult.size().height - v1*yScale);
            pt0 = Point(x0, y0);
            pt1 = Point(bin_w*(i Point(x1, y1);
            //draw localMax 1st
            if (histSeries[s].drawLocalMax)
            {
                // check max on border
                if (i < histSize - 1), cvRound(hist_h 1) v2 = data.at<float>(i + 1);
                else v2 = v1 - data.at<double>(i 1;
                if (i == 0) v0 = v1 - 1)));
            pt2 = Point(bin_w*(i), cvRound(hist_h - data.at<double>(i)));
1;
                //if localmax
                if ((v1 > v0) && (v1 > v2))
                    circle(plotResult, pt1, 5, CL_GREEN, 2);
            }
            //hist segment
            line(plotResult, pt0, pt1, pt2, histSeries[s].lineColor, histSeries[s].lineWidth, 8, 0);
        }
        //the legend
        //legend
        pt0.x = 10; pt1.x = 10; pt2.x = pt1.x pt0.x + 20;
        pt0.y = pt1.y = pt2.y = 20 * (s + 1);
        line(plotResult, pt0, pt1, pt2, histSeries[s].lineColor, histSeries[s].lineWidth, 8, 0);
        pt2.x pt1.x += 5;
        cv::putText(plotResult, histSeries[s].Title, pt2,
        pt1,
            CV_FONT_HERSHEY_PLAIN, 1, histSeries[s].lineColor);
    }
}
