This forum is disabled, please visit https://forum.opencv.org
| | 1 | initial version |
I've solved your problem, but the yellow is not very yellow, ahh
import cv2
import numpy as np
import matplotlib.pyplot as plt
from sklearn.cluster import k_means
img = cv2.imread("./grids.png")
gray = cv2.cvtColor(img, cv2.COLOR_BGR2GRAY)
img_hsv = cv2.cvtColor(img, cv2.COLOR_BGR2HSV)
mask = ((img_hsv > np.array([0, 0, 230])).astype(np.float32) + (img_hsv > np.array([0, 0, 230])).astype(np.float32) * (-0.5) + 0.5)
img_partly_darken = cv2.cvtColor(mask * img_hsv, cv2.COLOR_HSV2BGR)
plt.imshow(cv2.cvtColor(img_partly_darken, cv2.COLOR_BGR2RGB))
plt.show()
cv2.imwrite("t.png", img_partly_darken)
# Save the img now, and ... Surprise! You can feel the mystery:
plt.imshow(cv2.cvtColor(cv2.imread("t.png"), cv2.COLOR_BGR2RGB))
plt.show()
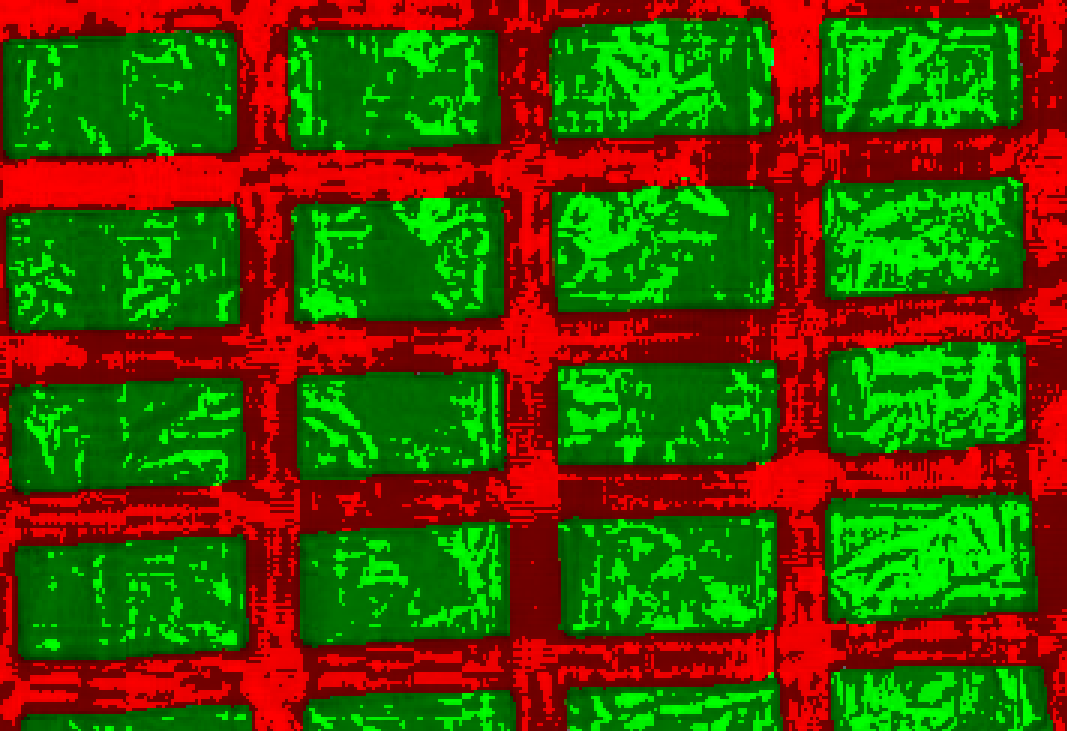
# Then, you can just pick out the green ones:
green_mask = img[:, :, 1] > img[:, :, 2] # value of green channel > that of red channel
# Here is a trick, I use color space convertion to boardcast one channel to three channels
green_mask = (green_mask.astype(np.uint8)) * 255
green_mask = cv2.cvtColor(green_mask, cv2.COLOR_GRAY2BGR)
green3_mask = (green_mask > 0).astype(np.uint8) * 255
img_green = cv2.bitwise_and(green3_mask, img)
plt.imshow(cv2.cvtColor(img_green, cv2.COLOR_BGR2RGB))
plt.show()
# Back to the original img's colors:
ret, thr = cv2.threshold(cv2.cvtColor(img_green, cv2.COLOR_BGR2GRAY), 10, 255, cv2.THRESH_BINARY)
blue_mask = (cv2.cvtColor(thr, cv2.COLOR_GRAY2BGR) > 0).astype(np.uint8) * 255
kernel_open =cv2.getStructuringElement(cv2.MORPH_RECT, (5, 5))
blue_mask = cv2.morphologyEx(blue_mask, cv2.MORPH_OPEN, kernel_open)
yellow_mask = 255 - blue_mask
# use k-means to get the two main colors -- blue and yellow
pixels = img
pixels = pixels.reshape(pixels.shape[0] * pixels.shape[1], 3)
[centroids, labels, inertia] = k_means(pixels, 2)
centroids = sorted(centroids.astype(np.uint8).tolist(), key=lambda x: x[0]) # B channel
blue_centroid = centroids[1]
yellow_centroid = centroids[0]
blue_ones = cv2.bitwise_and(blue_mask, centroids[1])
yellow_ones = cv2.bitwise_and(yellow_mask, centroids[0])
plt.imshow(cv2.add(blue_ones, yellow_ones))
plt.show()
May this can help you:)
| | 2 | No.2 Revision |
I've solved your problem, but the yellow is not very yellow, ahhyellow..
import cv2
import numpy as np
import matplotlib.pyplot as plt
from sklearn.cluster import k_means


img = cv2.imread("./grids.png")
gray = cv2.cvtColor(img, cv2.COLOR_BGR2GRAY)
img_hsv = cv2.cvtColor(img, cv2.COLOR_BGR2HSV)
mask = ((img_hsv > np.array([0, 0, 230])).astype(np.float32) + (img_hsv > np.array([0, 0, 230])).astype(np.float32) * (-0.5) + 0.5)
img_partly_darken = cv2.cvtColor(mask * img_hsv, cv2.COLOR_HSV2BGR)
plt.imshow(cv2.cvtColor(img_partly_darken, cv2.COLOR_BGR2RGB))
plt.show()

cv2.imwrite("t.png", img_partly_darken)
# Save the img now, and ... Surprise! You can feel the mystery:
plt.imshow(cv2.cvtColor(cv2.imread("t.png"), cv2.COLOR_BGR2RGB))
plt.show()

# Then, you can just pick out the green ones:
green_mask = img[:, :, 1] > img[:, :, 2]    # value of green channel > that of red channel
# Here is a trick, I use color space convertion to boardcast one channel to three channels
green_mask = (green_mask.astype(np.uint8)) * 255
green_mask = cv2.cvtColor(green_mask, cv2.COLOR_GRAY2BGR)
green3_mask = (green_mask > 0).astype(np.uint8) * 255
img_green = cv2.bitwise_and(green3_mask, img)
plt.imshow(cv2.cvtColor(img_green, cv2.COLOR_BGR2RGB))
plt.show()

# Back to the original img's colors:
ret, thr = cv2.threshold(cv2.cvtColor(img_green, cv2.COLOR_BGR2GRAY), 10, 255, cv2.THRESH_BINARY)
blue_mask = (cv2.cvtColor(thr, cv2.COLOR_GRAY2BGR) > 0).astype(np.uint8) * 255
kernel_open =cv2.getStructuringElement(cv2.MORPH_RECT, (5, 5))
blue_mask = cv2.morphologyEx(blue_mask, cv2.MORPH_OPEN, kernel_open)
yellow_mask = 255 - blue_mask

# use k-means to get the two main colors -- blue and yellow
pixels = img
pixels = pixels.reshape(pixels.shape[0] * pixels.shape[1], 3)
[centroids, labels, inertia] = k_means(pixels, 2)
centroids = sorted(centroids.astype(np.uint8).tolist(), np.array(sorted(centroids.astype(np.uint8).tolist(), key=lambda x: x[0]) x[0]))       # B channel
blue_centroid = centroids[1]
yellow_centroid = centroids[0]
blue_ones = cv2.bitwise_and(blue_mask, centroids[1])
yellow_ones = cv2.bitwise_and(yellow_mask, centroids[0])
plt.imshow(cv2.add(blue_ones, yellow_ones))
plt.imshow(cv2.cvtColor(cv2.add(blue_ones, yellow_ones), cv2.COLOR_BGR2RGB))
plt.show()
The img_partly_darken
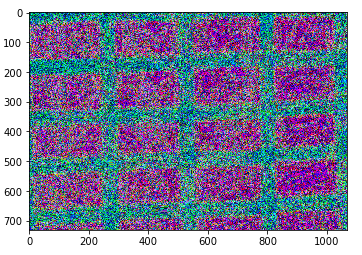
Imread the imwriten:
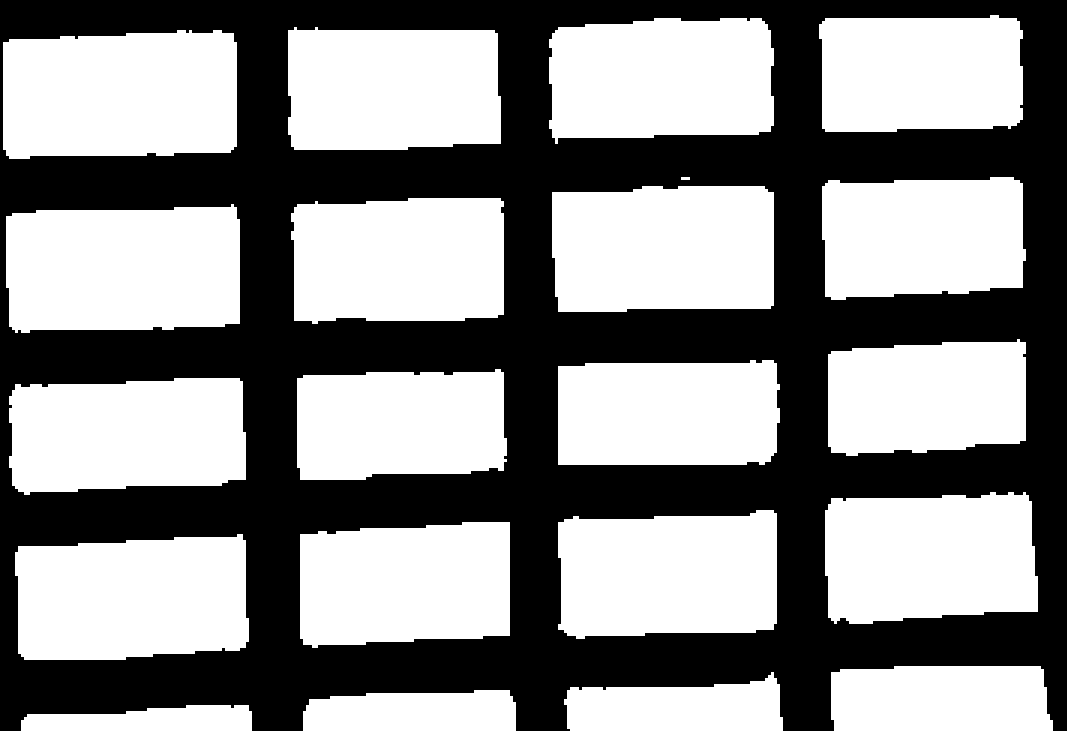
The blue_mask:
And the final result:
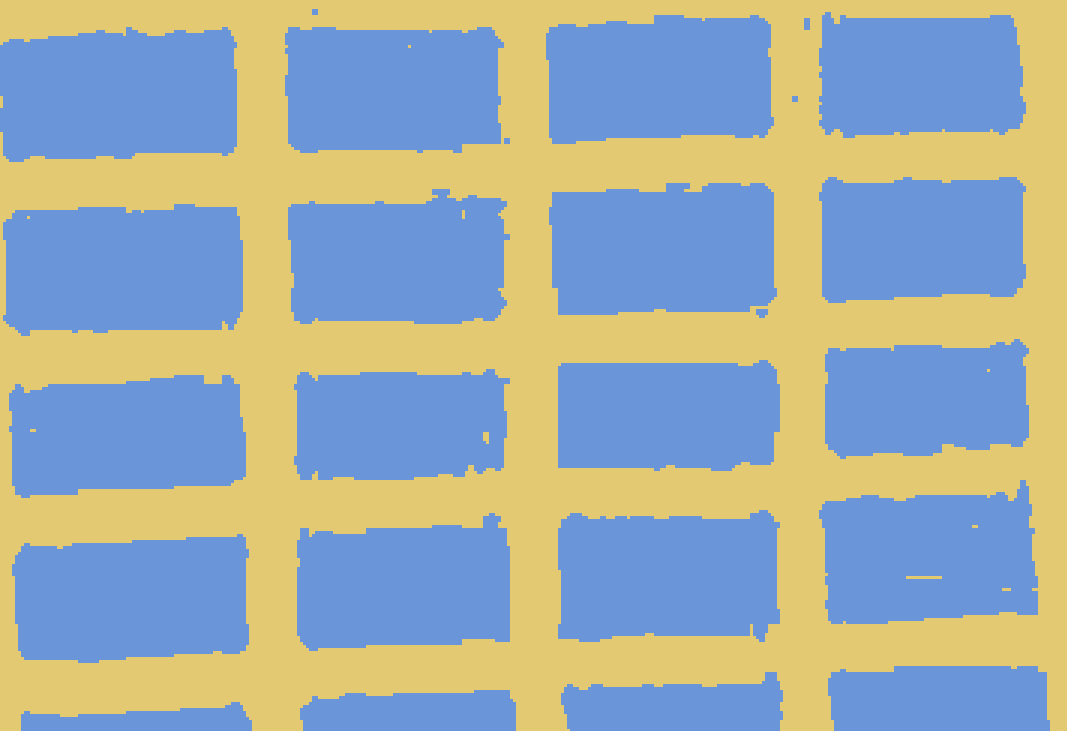
May this can help you:)
