This forum is disabled, please visit https://forum.opencv.org
| | 1 | initial version |
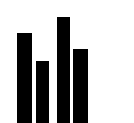
Basically you need to think about how a histogram is built up. You can see it as towers of pixels indicating the amount in each bin.
So what I would do is, create an image with heigth larger than the largest bin height. As width you assign amountofbins10 + amountofbin2. This gives you the ability to create vertical rows of 10 bits wide and leave 2 bits between each row.
Than simply create a binary mask simulating your data. Add 1's for the elements that need to be coloured, add 0 for items that need to be background.
It would look something like this: