I have an image where I have identified a points of interest. Each point has an associated 0-100 value with it. I would like to display the data in a manner that would show trends.
A couple thoughts I have had:
- Some kind of heatmap
- An algorithm similar to watershed which fills at each point until another filling boundary has been reached
I haven't really been able to come up with anything using OpenCV. I know it isn't really geared towards visualization, but I am trying to make it work.
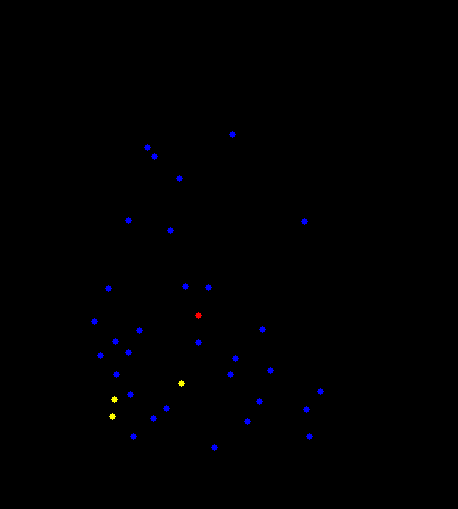
I have attached an image which I have drawn points onto to show what I am referencing, the values have been binned into three colors for simplicity. The goal is to expand each of those points into a larger visualization using the associated 0-100 value instead of point density. Are there any standard methods for this or anything I should be looking into?