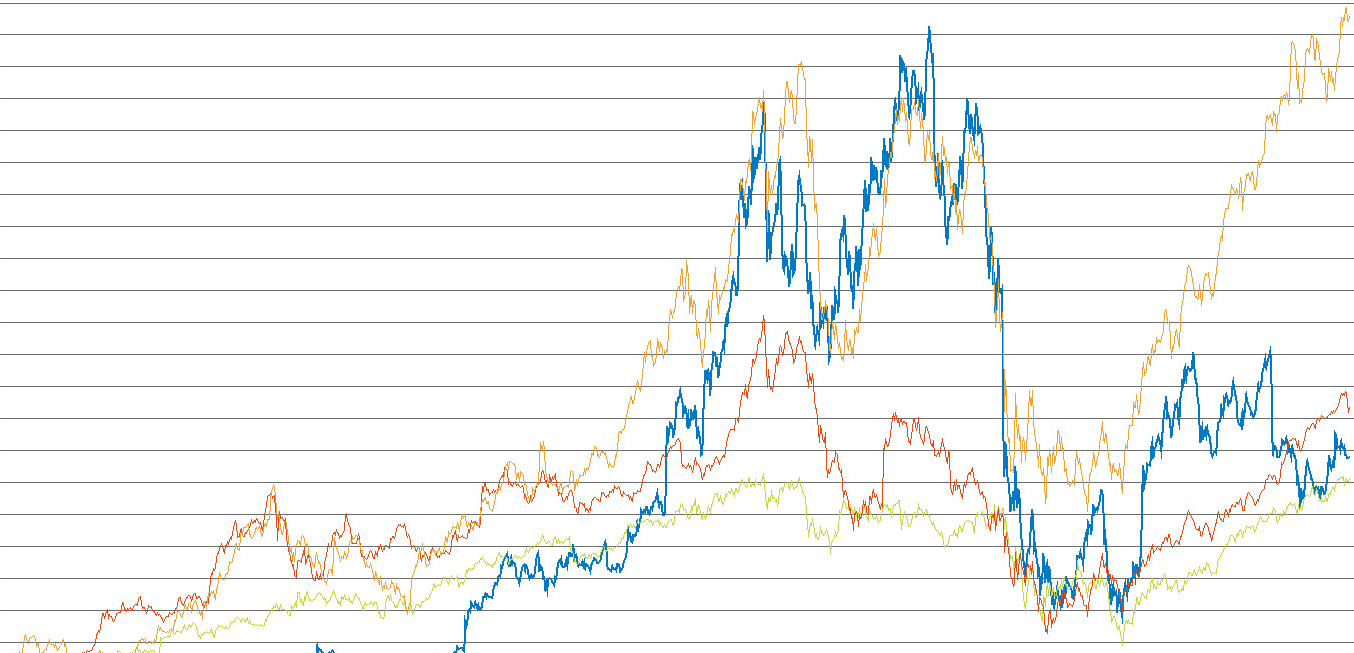
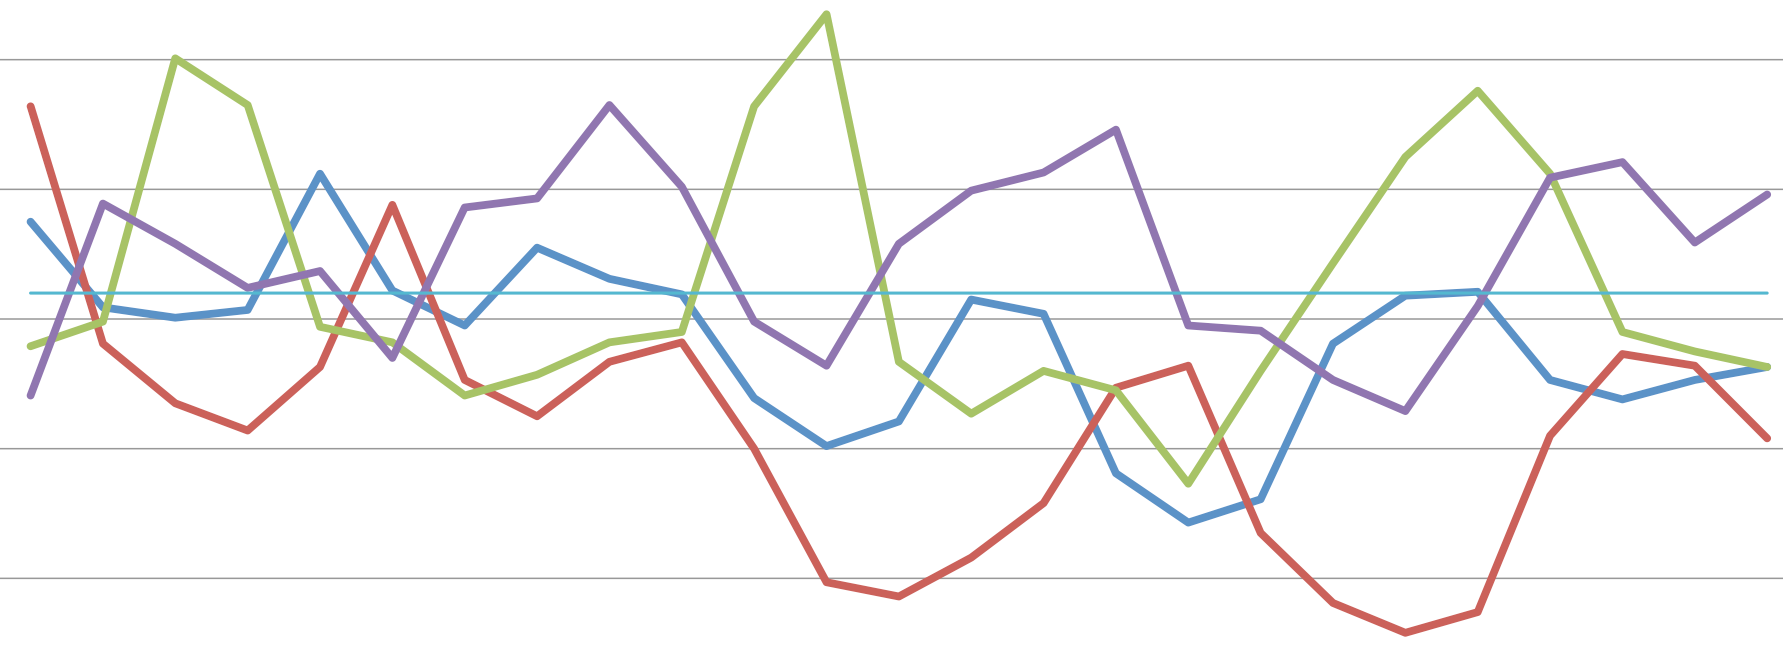
First of all I am beginner on this field and hoping to get help from you.
I would like to recognize line chart and get (x,y) values from chart into excel.
Charts could look like this.

or like this

Charts are in cartesian coordinate. I have checked this. But couldnt understand all the logic fully and feels like it's little outdated. Could you please describe the steps, papers, algorithms and/or specific modules from OpenCV which I should read in order to accomplish my task. Please let me know if I should add specific details.

