I am using v3.0 of OpenCV, which is currently still under development. I observe surprising performance behavior when executing arithmetic operations using the cv::UMat class. Just to preface, I understand cv::UMat invokes operations seamlessly on the GPU via OpenCL (note, I observed the load/memory on the GPU increased using GPU-Z, which is a GPU information utility that provides resource usage, memory usage, etc. www.techpowerup.com/gpuz). My machine has the following specifications: Intel Xeon (X5672) @ 3.2GHz, 24GB memory, NVIDIA GeForce GTX580, Windows 8.1 (x64), Visual Studio 2012 Ultimate (x64).
The code below provides an illustration of the experiments performed, which is characteristic of other proprietary code that cannot be provided:
// allocate host buffer
cv::Mat host1 = cv::Mat(10000, 10000, cv::DataType<float>::type);

// populate host buffer with random data
cv::randu(host1, cv::Scalar::all(-1e20), cv::Scalar::all(1e20));

// copy host buffer to device buffer
cv::UMat device1;
host1.copyTo(device1);

// execute arithmetic operations
cv::UMat device2;
for (int i = 0; i < 1000; i++)
{
    cv::multiply(device1, device1, device2); i++;
    cv::add(device1, device2, device2);      i++;
    cv::divide(device1, device2, device2);   i++;
    cv::subtract(device1, device2, device2); i++;
}

// copy device buffer to host buffer
cv::Mat host2;
device2.copyTo(host2);
The code above is a simplified version taken from a comprehensive test environment that allows for inspection of execution time relationships with respect to experiment variables (e.g., buffer size, number of arithmetic operations, etc.). Note, the code above exhibits the problem that will be described. The code was instrumented with timing functions from the Windows API (i.e., QueryPerformanceFrequency, QueryPerformanceCounter) to extract execution timing. Each step in the procedure is analyzed:
- Allocate host buffer
- Copy host buffer to device
- Execute arithmetic operations
- Copy device buffer to host
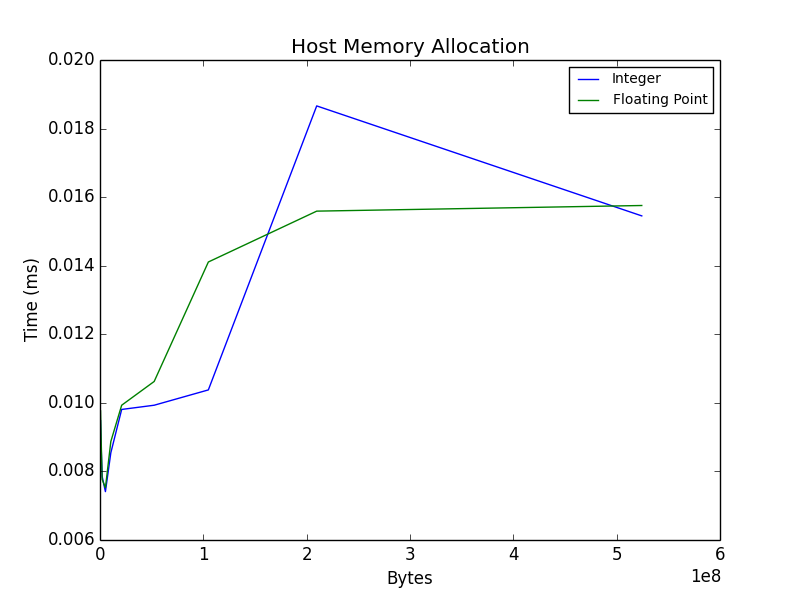
Allocate host buffer
First, the host buffer is allocated, the plot below illustrates the amount of time it takes to allocate an integer and float32 buffer as a function of size. The result seems reasonable.
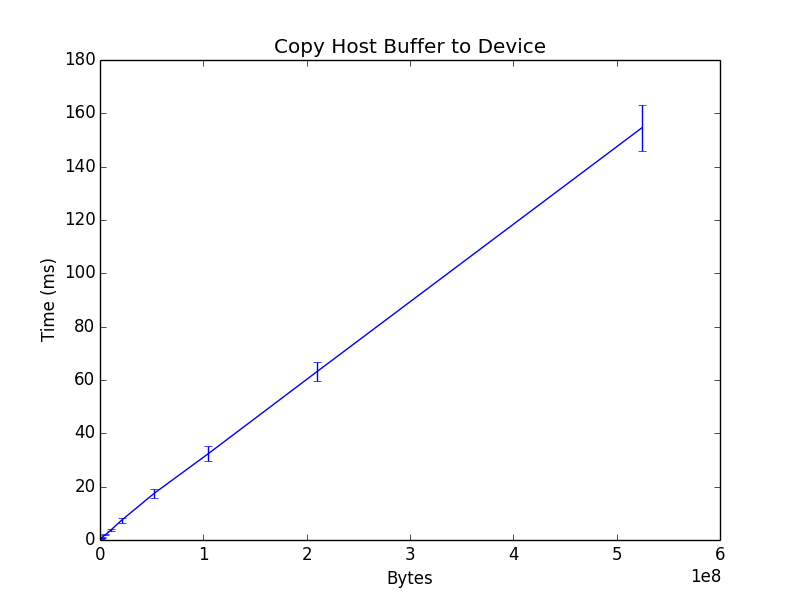
Copy host buffer to device
Note: in the following steps, only the float32 result will be shown, as this is consistent with the integer result.
The host buffer is copied to the device using the cv::Mat::copyTo method, the result seems reasonable.
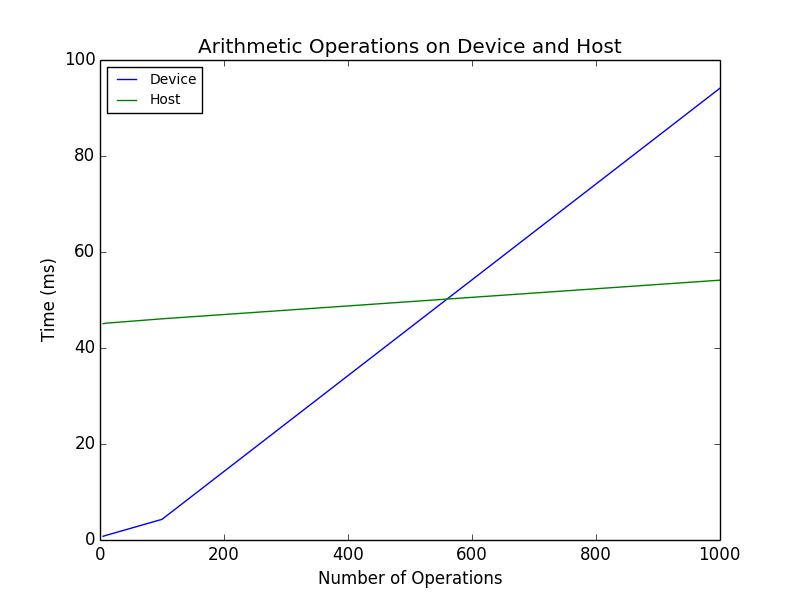
Execute arithmetic operations
Next, the arithmetic operations are invoked. This result is a bit surprising, as the expectation is that the slope of the device (GPU) line should be less than the host (CPU). The GPU line might have a larger bias- i.e., the host might appear faster initially given less operations, but the GPU should ultimately be faster given more operations.
Note: the plot illustrates timing for a 500MB buffer (11448x11448).
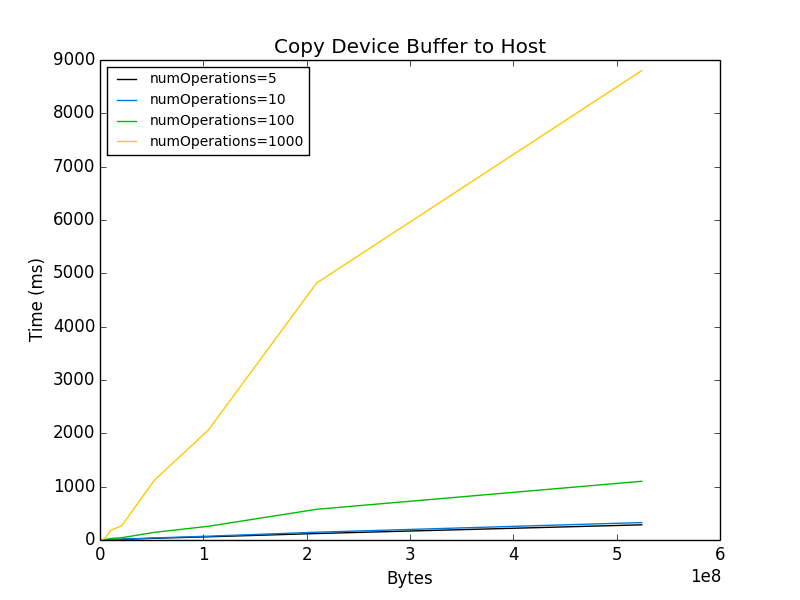
Copy device buffer to host
This leads to the motivation for posting this issue to the group. The buffer transfer time to the host appears to be dependent on the number of operations performed!
If anyone can offer some insight into this issue, it would be greatly appreciated! Thanks for your time!
-Adam Rossi