I'm evaluating the Face Recognition results with Eigenface. Below are the criteria for evaluation: FAR - False Acceptance Rate FRR - False Rejection Rate EER - Equal Error Rate
Working with 10 classes with 10 samples per class (100 training faces)
- FAR is an Inter Comparison (within several class):
Is performed based on one class(10 samples) compare with other 9 classes = 90 samples per class (excluding the samples that current class has in comparison steps) Total datapoints to be obtained is 10 class x 10 samples x 90 = 9000 datapoints/comparisons User1Sample1->User2Sample1 . . User1Sample2->User2Sample10
User1Sample1->User3Sample1
. . User1Sample10->User3Sample10
In OpenCV programming, it is performed by collecting 90 training images (9 classes) and produced 89 eigenfaces (9 classes) while another 1 class with 10 samples are used to compare with 1st Eigenface since it is most useful and contained most information, to obtain the similarity index, the purpose is to compare every classes' samples with another class' samples, where only 2 images comparing with each other at a time. However, it involves 9000 times comparison to be done, therefore, User1Sample1 is compared with 1st Eigenface produced by other 9 classes instead of User2Sample1 (similarity index obtained is in between 50%-100%=0.5-1.0)
- FRR is an Intra comparison (within 1 class):
10C2 = 45 data/comparisons (nCr - combination)
Evaluating 1 class, with 10 samples, comparing 2 training images at a time will obtain 45 datapoints/comparisons for plotting FRR graph.
User1Sample1-> User1Sample2 ( "->" means compare with) . . User1Sample1 -> User1Sample10
User1Sample2-> User2Sample3 . . User1Sample2 -> User1Sample10
In OpenCV programming, similarly, only 1 class is used to produced the Eigenface Set, with 10 samples of each class, it produces 9 Eigenfaces. However, the similarity index produced is so low (10%=0.1), therefore, I planned to duplicate the sample of the same class 9 times since FAR uses Eigenface produced by 9 classes. So current I'm having 90 traing images of 1 class, where 1 sample duplicated 10 times. Because FRR comparison should not compare with it own sample, therefore 9 comparisons in 1st round, 8 comparisons in 2nd round and the following 7,6,5,4,3,2,1 total up 45 datapoints/comparison. The evaluation I performed is by User1Sample1 compare with 1st Eigenface (produced other 9 other samples in the same class where each sample duplicated 10 times)
Since we have 10 classes, 45 datapoints per class, we will obtain 450 datapoints.
Below is the graph obtained 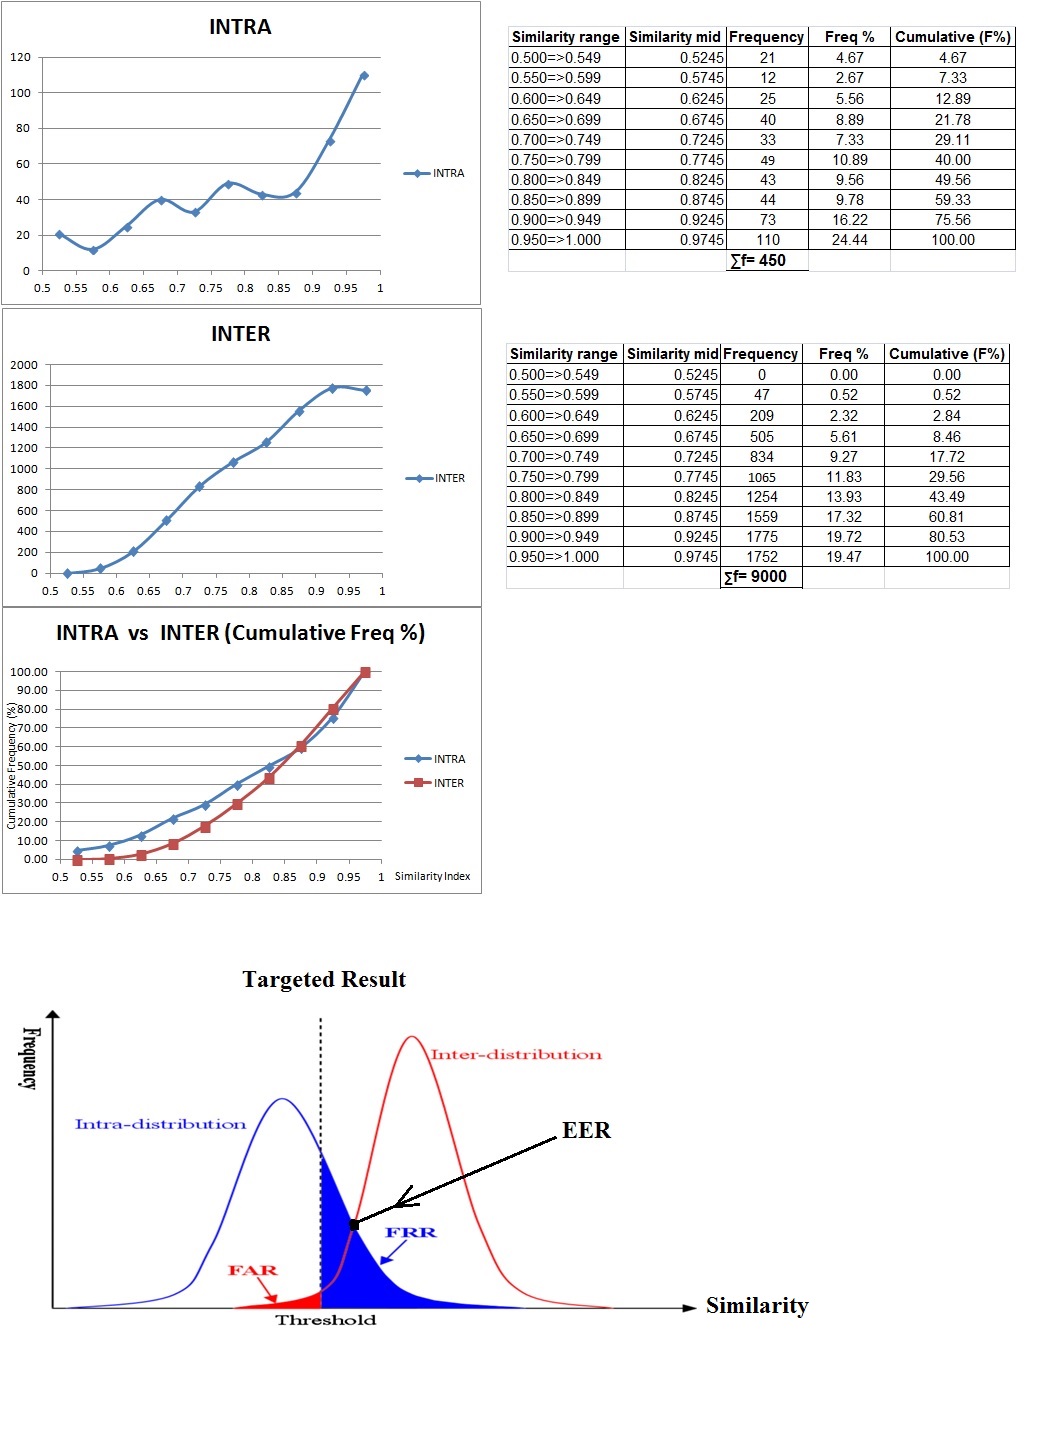
As seen from above plots, the results obtained is not as expected, where Inter comparison obtained quite high similarity where it not suppose to be.
Questions:
Are the methods/ways used FAR & FRR correct?
Is the 1st Eigenface represents all other training faces in the face database?
Comparison between user1 face with user2 face, but method used was by comparing user1 face with 1st Eigenface of produced by other 9 users (1st Eigenface of 90 users). With assumption that 1st Eigenface represents all faces in the training set and ignoring other Eigenfaces since only 1st return the most similarty.
Is the data acquired and plots for FAR & FRR shown above correct?
How to make it a smooth bell curve as shown in targeted result for FAR & FRR?
While composing the FAR & EER curves, it seems like seperation between the 2 curves and they are not intersecting with each other, therefore failed to obtained the EER point. As seen from the data tabulated, FAR has higher frequency than FRR data, there fore it is hanging/floating and not intersecting with each other. How to make both curves intersect with each other to find the EER, region of convergence.
Is it correct to plot the cumulative curve so that the intersection, EER point could be obtained?
Is there any other method use for evaluating Eigenface result?