This forum is disabled, please visit https://forum.opencv.org
| | 1 | initial version |
The comment by Sanchopanza is right, convexHull() is effective.
And here is the code, I hope this can help you.
By the way I guess the white spaces around the image was caused by using plt.savefig() to save the image, so I just remove them manually.
import cv2
import numpy as np
import matplotlib.pyplot as plt


img = cv2.imread(r'./a.png')

# binarization
img_gray = cv2.cvtColor(img, cv2.COLOR_BGR2GRAY)
ret, img_bw = cv2.threshold(img_gray, 120, 255, cv2.THRESH_BINARY)

# find contours of letters
img_t, contours, hierarchy = cv2.findContours(img_bw, cv2.RETR_TREE, cv2.CHAIN_APPROX_SIMPLE)

# combine all the [[y, x]] from all contours into one.
cnt_together = []
for i in contours:
    for j in i.tolist():
        cnt_together.append(j)
cnt_together = np.array(cnt_together)

hull = cv2.convexHull(cnt_together)
hull = np.array([np.squeeze(hull).tolist()])

cv2.drawContours(img, hull, 0, (255, 0, 0), thickness=2)
plt.figure(1)
plt.ion()
plt.imshow(img)
for i in range(len(hull[0])):
    plt.scatter(hull[0][i][0], hull[0][i][1])
    plt.show()
    plt.pause(0.1)
plt.ioff()
plt.show()
And here is the effect image:
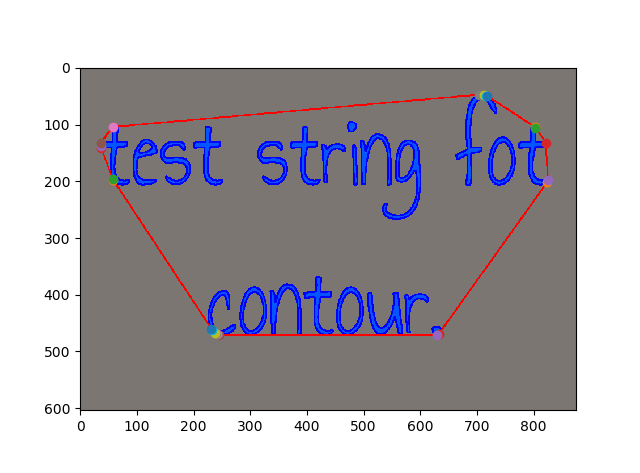
I hope these can help to inspire you.
| | 2 | No.2 Revision |
The comment by Sanchopanza is right, convexHull() is effective.
And the interpolation can make the boundary more wavy: link text.
And here is the code, I hope this can help you.
By the way I guess the white spaces around the image was caused by using plt.savefig() to save the image, so I just remove them manually.
import cv2
import numpy as np
import matplotlib.pyplot as plt
from scipy.interpolate import splprep, splev


img = cv2.imread(r'./a.png')
cv2.imread(r'./test_string_for_contour.png')

# binarization
img_gray = cv2.cvtColor(img, cv2.COLOR_BGR2GRAY)
ret, img_bw = cv2.threshold(img_gray, 120, 255, cv2.THRESH_BINARY)

# find contours of letters
img_t, contours, hierarchy = cv2.findContours(img_bw, cv2.RETR_TREE, cv2.CHAIN_APPROX_SIMPLE)

# combine all the [[y, x]] from all contours into one.
cnt_together = []
for i in contours:
    for j in i.tolist():
        cnt_together.append(j)
cnt_together = np.array(cnt_together)

hull = cv2.convexHull(cnt_together)
hull = np.array([np.squeeze(hull).tolist()])

cv2.drawContours(img, hull, 0, (255, 0, 0), thickness=2)
t = []
hull = hull[0]

img_bw_cp = img_bw.copy()

# referred from https://stackoverflow.com/questions/31464345/fitting-a-closed-curve-to-a-set-of-points
tck, u = splprep(hull.T, u=None, s=0.0, per=1)
u_new = np.linspace(u.min(), u.max(), 1000)
x_new, y_new = splev(u_new, tck, der=0)

hull_smoothed = np.vstack((x_new, y_new)).T

plt.figure(1)
plt.ion()
plt.imshow(img)
for i in range(len(hull[0])):
    plt.scatter(hull[0][i][0], hull[0][i][1])
    plt.show()
    plt.pause(0.1)
plt.ioff()
plt.imshow(cv2.cvtColor(img, cv2.COLOR_BGR2RGB))
plt.plot(hull_smoothed[:, 0], hull_smoothed[:, 1], color="white", linewidth=5)
plt.plot(hull[:, 0], hull[:, 1], 'ro')

plt.show()
And here is the effect image:
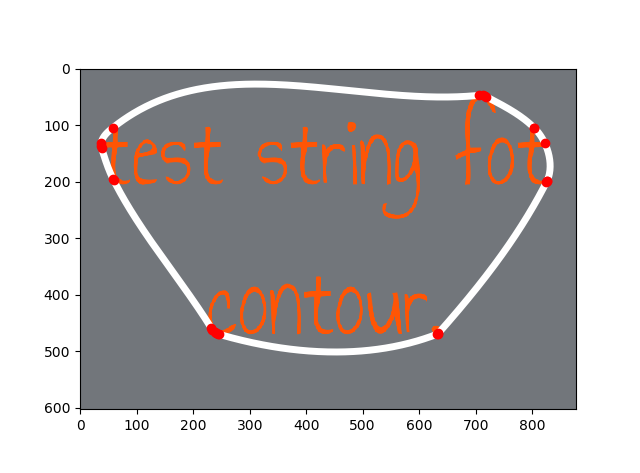
I hope these can help to inspire you.
