This forum is disabled, please visit https://forum.opencv.org
| 2017-09-15 18:52:10 -0600 | received badge | ● Student (source) |
| 2017-07-05 09:50:29 -0600 | commented question | about opencv plot thanks for reply, but is there any way the solve the problem? |
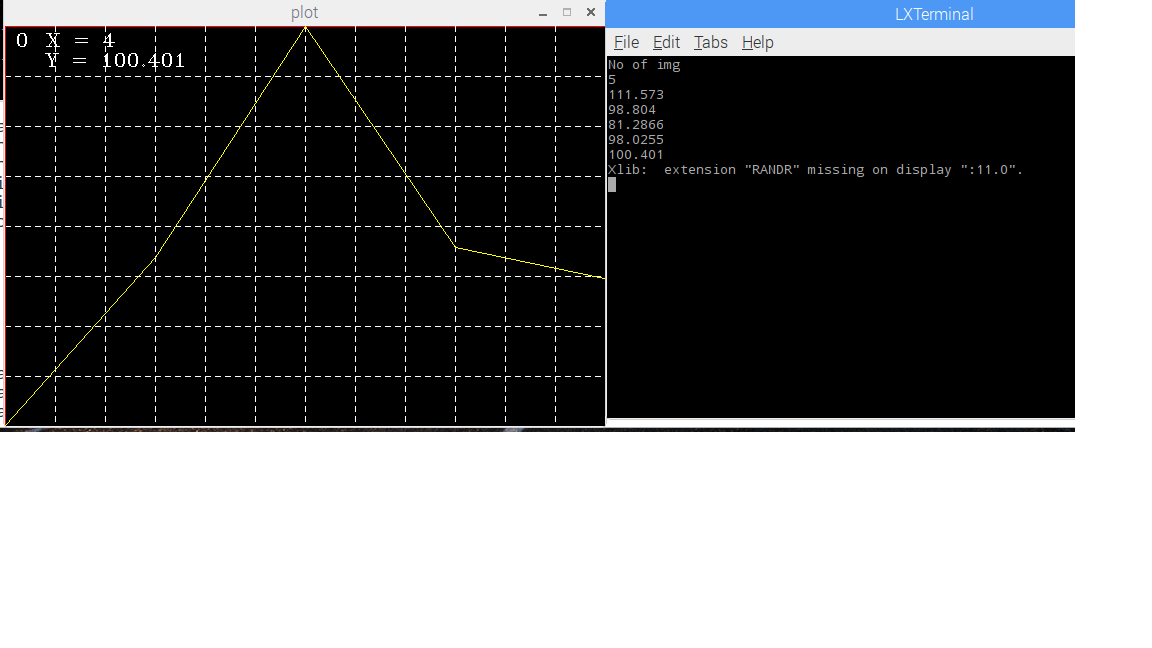
| 2017-07-04 17:35:45 -0600 | asked a question | about opencv plot Hello, I have used the plot function to plot the data of the Mat, but the result is inverted(up/down), when value is getting lower the curve is going up, to a higher values it's going down. It's my problem or the plot function is like that?
|