Hi,
I am using the following code :
import numpy as np
import cv2
import matplotlib.pyplot as plt
im = cv2.imread('shapes.png')
imgray = cv2.cvtColor(im,cv2.COLOR_BGR2GRAY)
image, contours, hierarchy = cv2.findContours(imgray,cv2.RETR_EXTERNAL,cv2.CHAIN_APPROX_NONE)
img = cv2.drawContours(im, contours, -1, (0,255,255), 3)
plt.imshow(img)
plt.show()


lower = np.array([0, 0, 0])
upper = np.array([255, 255, 255])
shapeMask = cv2.inRange(im, lower, upper)

# find the contours in the mask
(_,cnts, _) = cv2.findContours(shapeMask.copy(), cv2.RETR_EXTERNAL,cv2.CHAIN_APPROX_SIMPLE)
print "I found %d black shapes" % (len(cnts))
cv2.imshow("Mask", shapeMask)

# loop over the contours
for c in cnts:
    # draw the contour and show it
    cv2.drawContours(image, [c], -1, (0, 255, 0), 2)
    cv2.imshow("Image", image)
    cv2.waitKey(0)
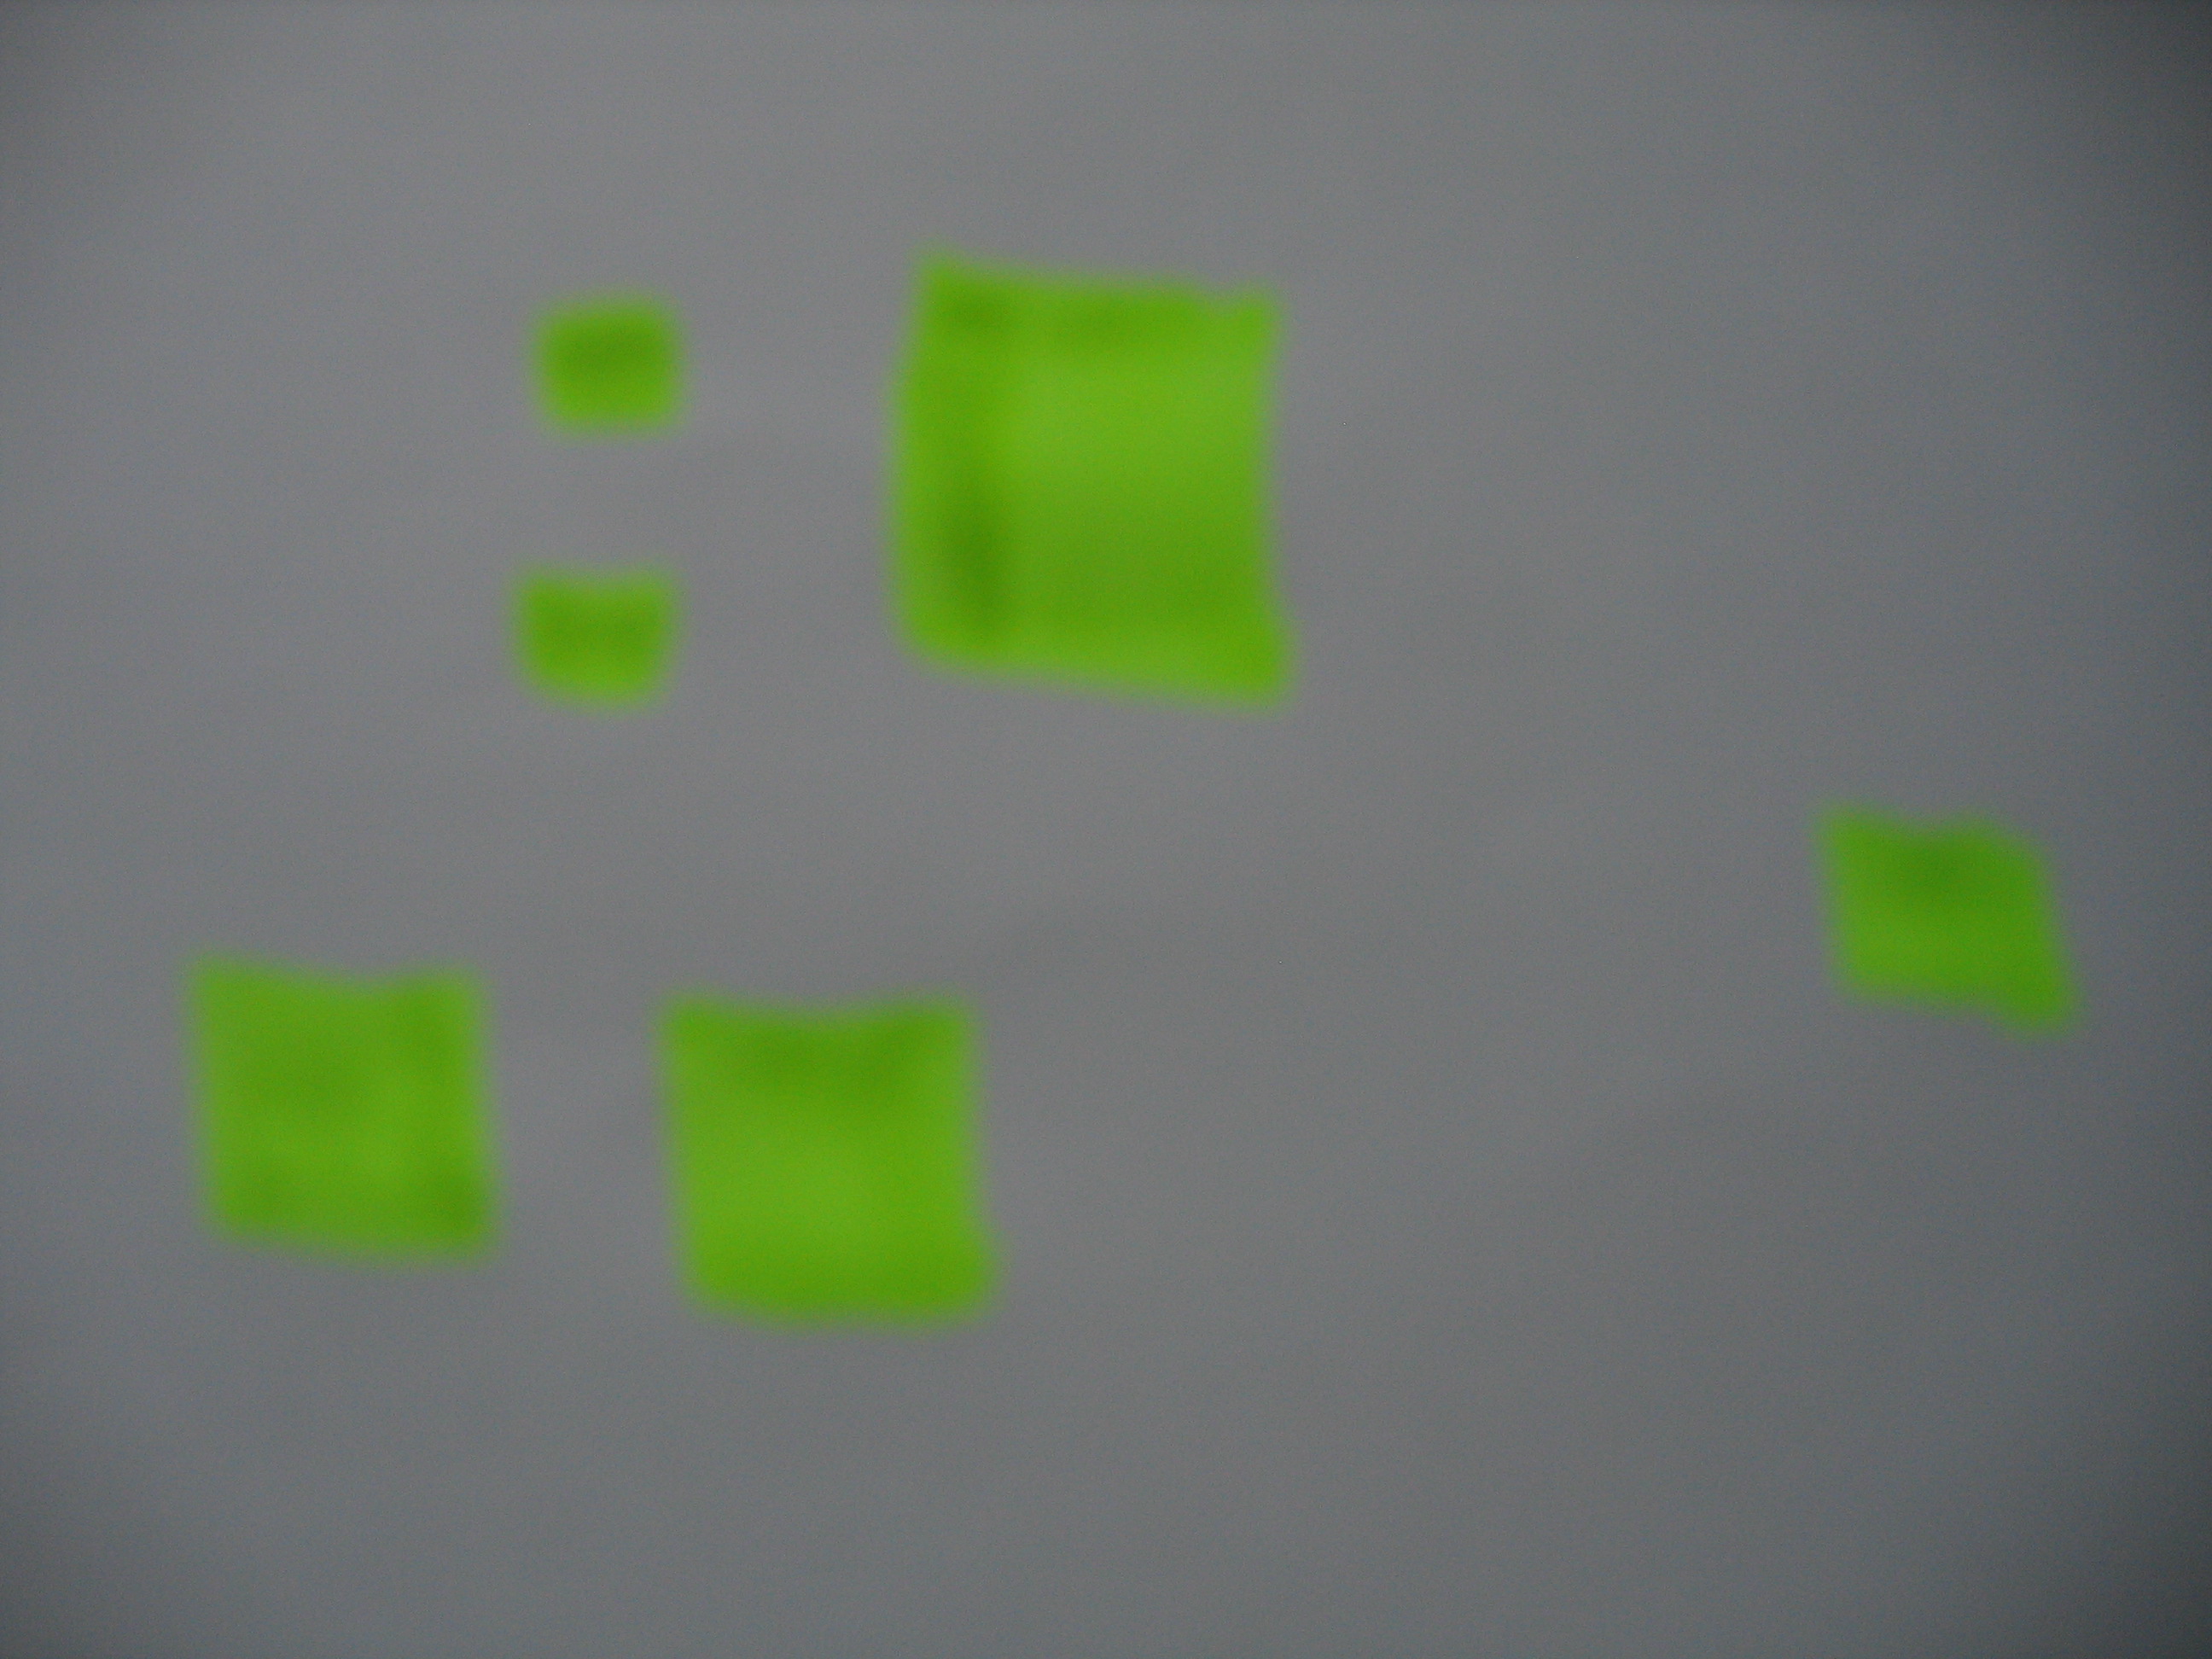
I am trying to find contours and have tried 2 different methods with two different images. Both of them dont work. Could someone pleass help me out?


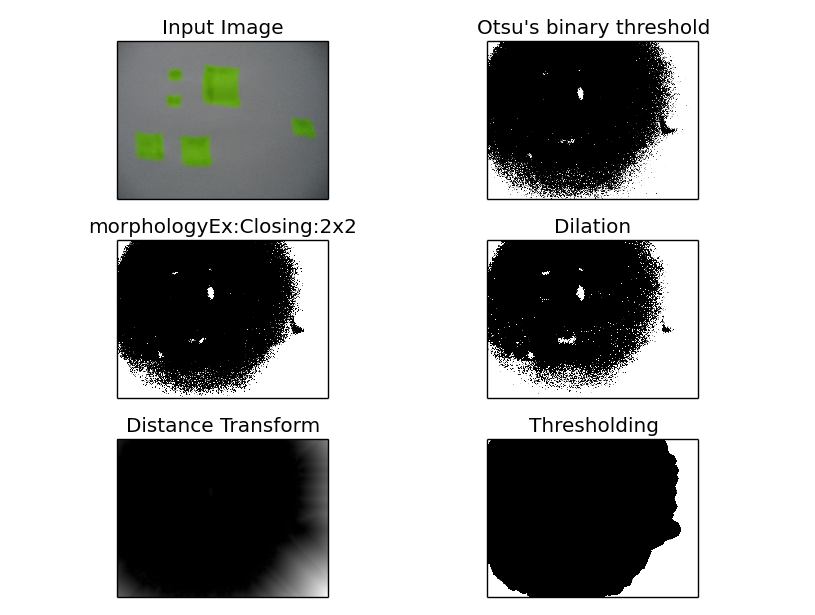
Trying watershed algortihm on this image:
import numpy as np
import cv2
from matplotlib import pyplot as plt

img = cv2.imread('IMG_1340.jpg')
b,g,r = cv2.split(img)
rgb_img = cv2.merge([r,g,b])

gray = cv2.cvtColor(img,cv2.COLOR_BGR2GRAY)
ret, thresh = cv2.threshold(gray,0,255,cv2.THRESH_BINARY_INV+cv2.THRESH_OTSU)

# noise removal
kernel = np.ones((2,2),np.uint8)
#opening = cv2.morphologyEx(thresh,cv2.MORPH_OPEN,kernel, iterations = 2)
closing = cv2.morphologyEx(thresh,cv2.MORPH_CLOSE,kernel, iterations = 2)

# sure background area
sure_bg = cv2.dilate(closing,kernel,iterations=3)

# Finding sure foreground area
dist_transform = cv2.distanceTransform(sure_bg,cv2.DIST_L2,3)

# Threshold
ret, sure_fg = cv2.threshold(dist_transform,0.1*dist_transform.max(),255,0)

plt.subplot(321),plt.imshow(rgb_img)
plt.title('Input Image'), plt.xticks([]), plt.yticks([])
plt.subplot(322),plt.imshow(thresh, 'gray')
plt.title("Otsu's binary threshold"), plt.xticks([]), plt.yticks([])

plt.subplot(323),plt.imshow(closing, 'gray')
plt.title("morphologyEx:Closing:2x2"), plt.xticks([]), plt.yticks([])
plt.subplot(324),plt.imshow(sure_bg, 'gray')
plt.title("Dilation"), plt.xticks([]), plt.yticks([])

plt.subplot(325),plt.imshow(dist_transform, 'gray')
plt.title("Distance Transform"), plt.xticks([]), plt.yticks([])
plt.subplot(326),plt.imshow(sure_fg, 'gray')
plt.title("Thresholding"), plt.xticks([]), plt.yticks([])

plt.tight_layout()
plt.show()
What I get


