Ask Your Question

Revision history [back]

click to hide/show revision 1
initial version

Visualizing learned features from Haar cascade classifier

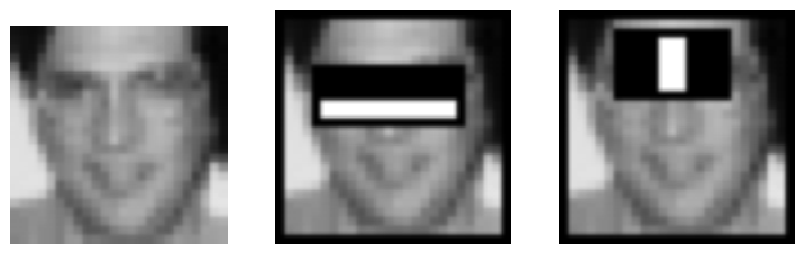
Using the opencv_traincascade application I have trained a cascade classifier using Haar features for car detection. The detector is working pretty good, but I am wondering what kind of rectangle features were selected using AdaBoost. In other words, I want to visualize the features in the same way Viola and Jones are doing in their paper for face detection. However I find the cascade.xml file not so trivial to interpreted, so I was wondering whether there is a way to visualise the 'learned' rectangular features?

image description

Visualizing learned features from Haar cascade classifier

Using the opencv_traincascade opencv_traincascade application I have trained a cascade classifier using on Haar features for car detection. The detector is working pretty good, but I am wondering what kind of rectangle features were selected using AdaBoost. In other words, I want to visualize the features in the same way Viola and Jones are doing in their paper for face detection. detection (see image below). However I find the cascade.xml file not so trivial to interpreted, so I was wondering whether there is a way to visualise the 'learned' rectangular features?

image description

Visualizing learned features from Haar cascade classifier

Using the opencv_traincascade application I have trained a cascade classifier on Haar features for car detection. The detector is working pretty good, but I am wondering what kind of rectangle features were selected using AdaBoost. In other words, I want to visualize the features in the same way Viola and Jones are doing in their paper for face detection (see image below). However I find the cascade.xml file not so trivial to interpreted, so I was wondering whether there is a way to visualise visualize the 'learned' rectangular features?

image description

Visualizing learned features from Haar cascade classifier

Using the opencv_traincascade application I have trained a cascade classifier on Haar features for car detection. The detector is working pretty good, but I am wondering what kind of rectangle features were selected using AdaBoost. In other words, I want to visualize the features in the same way Viola and Jones are doing in their paper for face detection (see image below). However I find the cascade.xml file not so trivial to interpreted, so I was wondering whether there is a way to visualize the 'learned' rectangular features?

image description