Ask Your Question

Revision history [back]

click to hide/show revision 1
initial version

Histogram Comparison Theory

I'm currently using Histogram Comparison, BhattaCharyya method to perform image processing in order to figure out the percentage of difference/ similarity out of two images. However, a weird result came out. From Figure (a) and Figure (b), the result is 0.0753672 and 0.103018 respectively. What I curious about is that Figure (a) shows more mismatch than Figure(b) but why value for Figure (a) is lower?! May I know in conceptual base, the reason and theory behind? Figure (a) Figure (b)

Histogram Comparison Theory

I'm currently using Histogram Comparison, BhattaCharyya method to perform image processing in order to figure out the percentage of difference/ similarity out of two images. However, a weird result came out. From Figure (a) and Figure (b), the result is 0.0753672 and 0.103018 respectively. What I curious about is that Figure (a) shows more mismatch than Figure(b) but why value for Figure (a) is lower?! May I know in conceptual base, the reason and theory behind? behind?
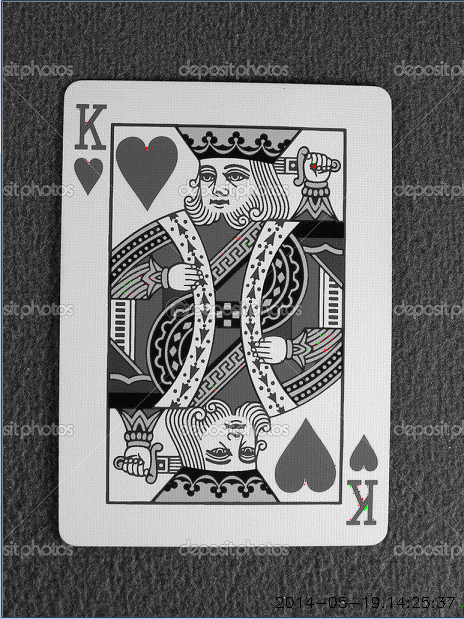
Figure (a) Figure (a)

Figure (b) Figure (b)