 Hello !
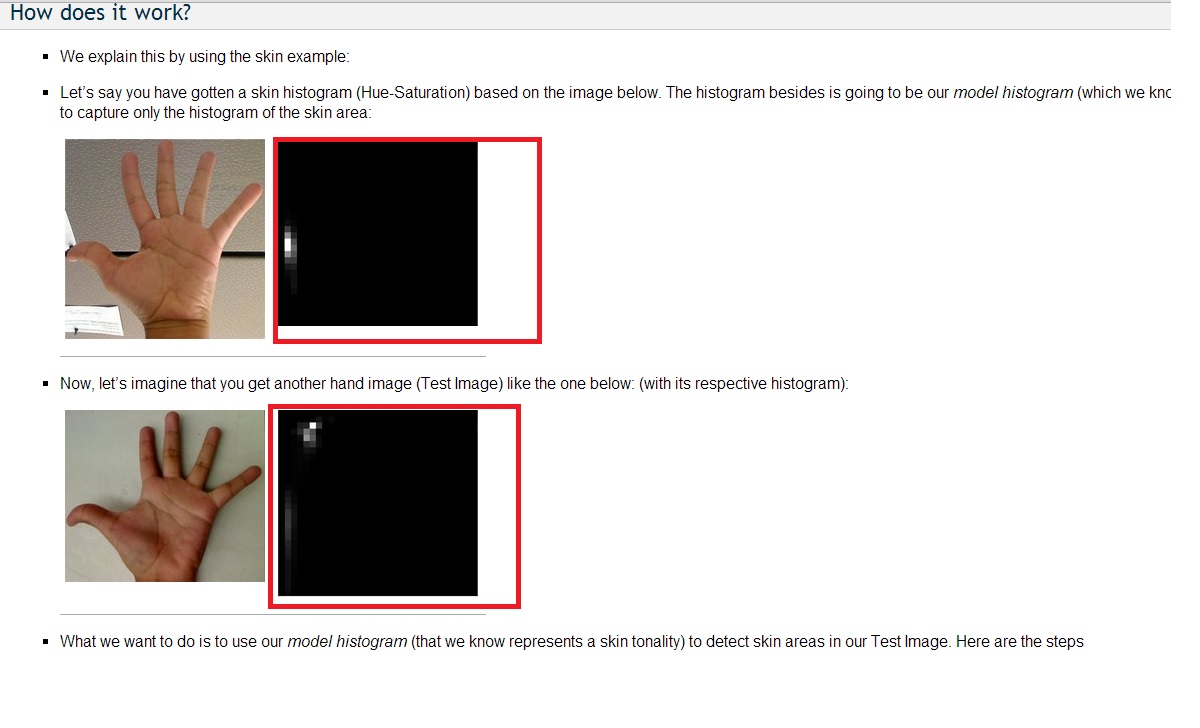
can anyone please tell me how to draw the images in the red rectangles ?
is it true that the X axis is SAT and the Y axis is HUE ?
is it a 2D histogram ?
thanks
 | 1 | initial version |
 Hello !
can anyone please tell me how to draw the images in the red rectangles ?
is it true that the X axis is SAT and the Y axis is HUE ?
is it a 2D histogram ?
thanks