Hi,
I'm looking for the best approach to detect and assess the thickness of the leftmost "line" in a noisy image.
( Lines represent layers of a material captured with OCT imaging ).
Three examples attached, with the line of interest partially highlighted in red (source images are greyscale).
A)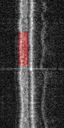 , B)
, B)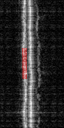 and C) (more difficult):
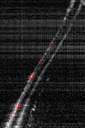
The leftmost band is (always) the line of interest; the next band is an underlying layer/interface; and the third band usually visible is actually a reflection of the first.
As you can tell (zooming in) images are noisy; each row is (in principle) a separate measurement - with occasional artefacts showing up. I don't need a 100% success rate, but over a series of measurements I'd like to report an averaged line thickness with a sub-pixel accuracy.
What are OpenCL primitives/operations that you would suggest using in this case? For instance: 1. Some de-noising 2. Detection of the right/left edges of the leftmost band 3. Reporting an average thickness with sub-pixel accuracy
Ultimate goal is to sort my 'samples', label areas with different thicknesses, and detect where was the thinnest/thickest zone within a labeled area resides)
I do have ideas from prior experience, but I'm looking for ideas on how OpenCV can be used here. Also I'll need a I will need a high processing throughput rate (say at least 100 such images per second).
Thanks in advance for sharing your ideas and insights, Ivan