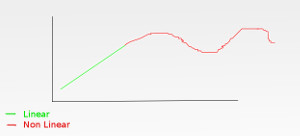
Sometimes you want to know where your data (i.e. temperature from the oven) are growing by a linear law, so you can obtain the interval within your system is -approximately- a linear one. It is possible using a lot of systems (from grouping point and verifying how good a straight line approximates those by a regression coefficient, to a neural network that identifies straight/curves).
To improve my OpenCV knowledge, my idea is grouping some points (stored in a .csv file) and testing by contour if they are aligned. Is it a reasonable way? Is there a more focused function that automatically create two groups, i.e "linear region" and "not linear region"?
Thanks a lot!