Hi,
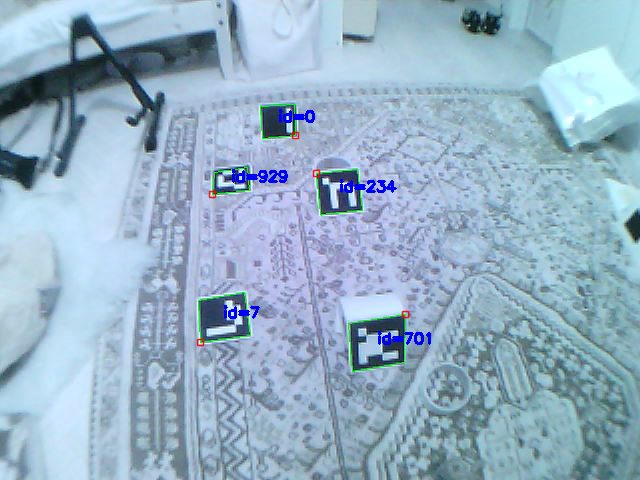
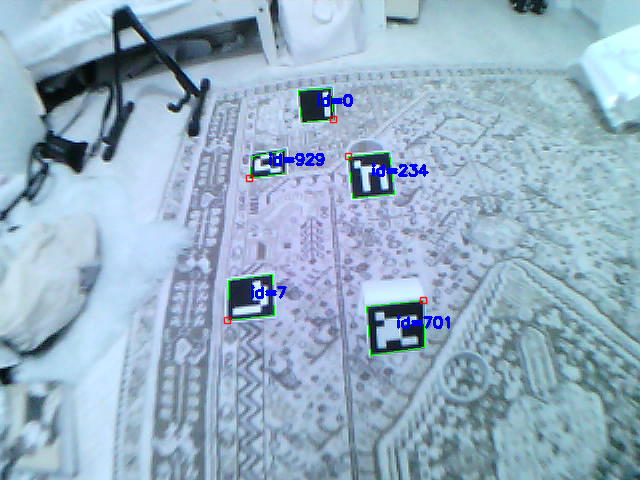
I am detecting ArUco Markers with a stereo setup and would like to know the 3d coordinates of the corners. I am using triangulatePoints to achieve that (the rig is fully calibrated and I am calling undistortPoints before triangulating), but I do not understand how to interpret the results. Here is an example:
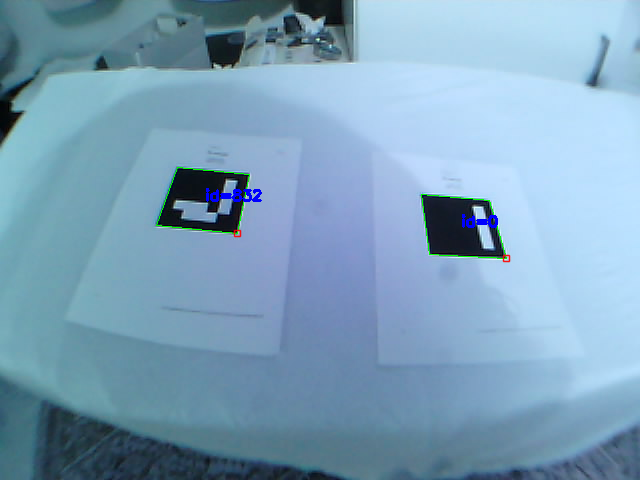
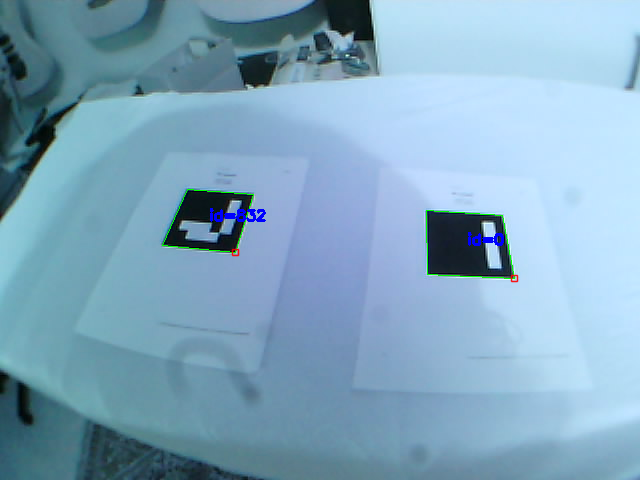
As you can see the markers are detected fine.
These are the calibration results:
cameraMatrix0: !!opencv-matrix
   rows: 3
   cols: 3
   dt: d
   data: [ 2.5311174347743417e+03, 0., 3.2231399009926719e+02, 0.,
       4.6591866011722777e+03, 2.3231970884577402e+02, 0., 0., 1. ]
cameraMatrix1: !!opencv-matrix
   rows: 3
   cols: 3
   dt: d
   data: [ 3.9081435924528068e+02, 0., 3.3479724827614308e+02, 0.,
       3.9086571426391373e+02, 2.4481462402639596e+02, 0., 0., 1. ]
distCoeffs0: !!opencv-matrix
   rows: 1
   cols: 5
   dt: d
   data: [ -7.1535649396300869e+00, 6.2303668870989661e+01,
       2.5290994534992603e-02, -9.5340988550797742e-02,
       1.6380154663238149e+00 ]
distCoeffs1: !!opencv-matrix
   rows: 1
   cols: 5
   dt: d
   data: [ -3.3057686811404841e-01, 9.0462193005730954e-02,
       3.0860163149006355e-03, -1.6494678844947317e-03,
       1.0576338181488755e-01 ]
R1: !!opencv-matrix
   rows: 3
   cols: 3
   dt: d
   data: [ 9.9822444172377511e-01, -5.9558176978770624e-02,
       8.8741209313436195e-04, 6.4577261236941699e-03,
       1.2302110541814526e-01, 9.9238304368575792e-01,
       -5.9213695363226251e-02, -9.9061527909510005e-01,
       1.2318728467162510e-01 ]
R2: !!opencv-matrix
   rows: 3
   cols: 3
   dt: d
   data: [ 9.9917941804743782e-01, 6.3673993344175858e-03,
       -3.9999334695711111e-02, 1.7145549728152451e-02,
       8.2822258780318958e-01, 5.6013692538263116e-01,
       3.6694967977951833e-02, -5.6036309771281689e-01,
       8.2743379073300671e-01 ]
P1: !!opencv-matrix
   rows: 3
   cols: 4
   dt: d
   data: [ -2.5122705918881995e+04, 0., 3.0483385086059570e+02, 0., 0.,
       -2.5122705918881995e+04, -1.3306875677704811e+03, 0., 0., 0., 1.,
       0. ]
P2: !!opencv-matrix
   rows: 3
   cols: 4
   dt: d
   data: [ -2.5122705918881995e+04, 0., 3.0483385086059570e+02, 0., 0.,
       -2.5122705918881995e+04, -1.3306875677704811e+03,
       1.7033439489107117e+08, 0., 0., 1., 0. ]
And here are the calculated points for the left marker:
Points left: [ 2.36548904e+02, 2.32737274e+02, 1.55980331e+02,
    2.25477417e+02, 1.76583099e+02, 1.67142105e+02, 2.49147156e+02,
    1.73582138e+02 ]
Points right: [ 2.34508652e+02, 2.52204666e+02, 1.61633667e+02,
    2.44712387e+02, 1.86742859e+02, 1.88699554e+02, 2.53478561e+02,
    1.93934402e+02 ]
Points left rectified: [ 6.90766846e+03, -2.00531344e+05, 1.30649561e+04,
    -1.94898406e+05, 1.03397646e+04, -1.78047422e+05, 5.27361719e+03,
    -1.82412734e+05 ]
Points right rectified: [ 9.69785156e+03, -1.91184590e+04,
    1.62403418e+04, -1.84124824e+04, 1.26653564e+04, -1.32631758e+04,
    7.41260742e+03, -1.38682227e+04 ]
points3d: !!opencv-matrix
   rows: 4
   cols: 4
   dt: f
   data: [ 3.98011282e-02, 7.33040348e-02, 6.26090020e-02,
       3.30100991e-02, -9.91356134e-01, -9.89016652e-01, -9.88104701e-01,
       -9.89974260e-01, -1.25015393e-01, -1.28345296e-01,
       -1.40460745e-01, -1.37336269e-01, -1.33160444e-04,
       -1.32999601e-04, -1.35896320e-04, -1.35903116e-04 ]
And for the right marker:
Points left: [ 5.05645966e+02, 2.57717621e+02, 4.29436829e+02,
    2.53785843e+02, 4.20575714e+02, 1.94067291e+02, 4.88867340e+02,
    2.00355560e+02 ]
Points right: [ 5.13522339e+02, 2.77673462e+02, 4.27125153e+02,
    2.73899353e+02, 4.25537781e+02, 2.10207703e+02, 5.01578827e+02,
    2.15161224e+02 ]
Points left rectified: [ -1.69565938e+04, -2.22116422e+05,
    -9.21793848e+03, -2.16441172e+05, -7.68458643e+03, -1.94189281e+05,
    -1.37641875e+04, -1.98591703e+05 ]
Points right rectified: [ -1.41168594e+04, -2.16621113e+04,
    -6.07958203e+03, -2.11762422e+04, -5.26969092e+03, -1.51815889e+04,
    -1.14783633e+04, -1.54386553e+04 ]
points3d: !!opencv-matrix
   rows: 4
   cols: 4
   dt: f
   data: [ -7.11075142e-02, -3.66982371e-02, -3.48484255e-02,
       -6.48639426e-02, -9.91074264e-01, -9.92581367e-01,
       -9.91020977e-01, -9.89899397e-01, -1.12762921e-01,
       -1.15911208e-01, -1.29085317e-01, -1.26063004e-01,
       -1.32714456e-04, -1.32891582e-04, -1.35669485e-04,
       -1.35559574e-04 ]
I read that the values for the x,y and z coordinates have to be divided by the 4th value, this would result in
(-299, 7454, 939)
(-551, 7436, 962)
(-460, 7271, 1033)
(-242, 7284, 1010)
for the left marker and in
(535, 7467, 849)
(276, 7473, 872)
(256, 7305, 950)
(478, 7302, 929)
for the right marker (If I made no typing mistakes, I calculated this myself).
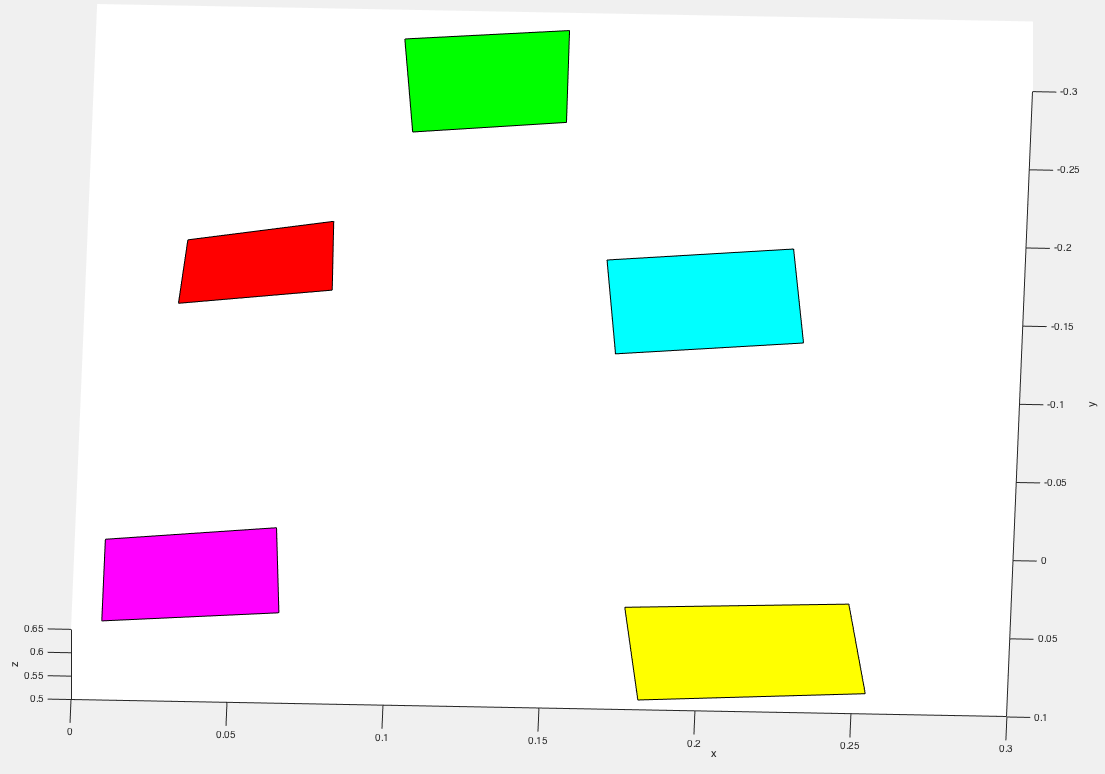
I plotted the 3d-coordinates and they do look like a square in 3d space, but I am wondering why the y-coordinate is so much larger than the x and that the x-values turn negative. Where is the origin of the coordinate-system that triangulatePoints is using?