How to display point data in a visually appealing way?
I have an image where I have identified a points of interest. Each point has an associated 0-100 value with it. I would like to display the data in a manner that would show trends.
A couple thoughts I have had:
- Some kind of heatmap
- An algorithm similar to watershed which fills at each point until another filling boundary has been reached
I haven't really been able to come up with anything using OpenCV. I know it isn't really geared towards visualization, but I am trying to make it work.
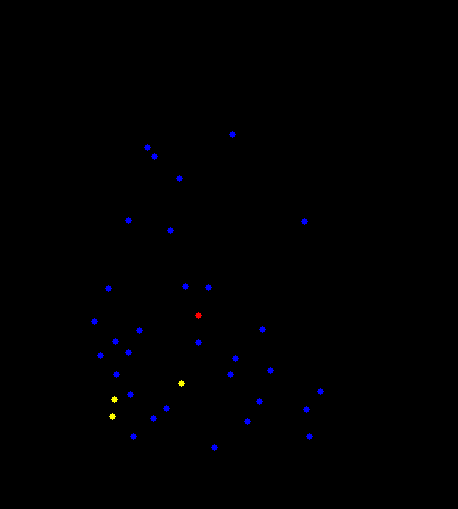
I have attached an image which I have drawn points onto to show what I am referencing, the values have been binned into three colors for simplicity. The goal is to expand each of those points into a larger visualization using the associated 0-100 value instead of point density. Are there any standard methods for this or anything I should be looking into?
if there is a relation between the point position / value / density, you 'll probably have to explain that to us.
Basically you are trying to visualise a 100 dimensional space into a visible space for users. On a conference some years ago I saw a presentation on parallell coordinates by the original author, which is ideal to find trends in high dimensional data. How about trying to create that one?
There is no immediate relation of value to density or position to density. I am trying to visualize a relation between value and position.
As far as parallel coordinates go, I am having trouble imagining how to retain position information. I suppose I could use distance and direction from some central point, but I don't think that is my best route.
Well it was only a suggestion. It is kind of a standard in computer vision when trying to visualize high dimensional data :)