Why does calcHist() method create an empty black histogram Mat?
I have written code to read in an image from gallery, then apply inRange() on it to find blue colored blob and create mask, then used findContours() to find contours, and the drawContours() to draw the contours, then boundingRect() to find a rectangle around the first contour, and then submat() to extract out the submatrix. Then I used Mat.zeroes() to create a mask from that rectangular submat. Then I applied Imgproc.calcHist() to create a histogram, and passed in the Mask as the 3rd argument so that the histogram calculated is that of the area inside the contour only.
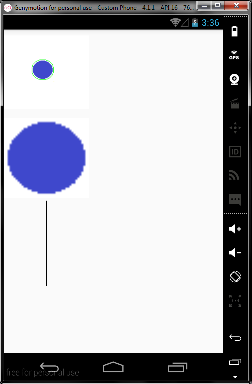
Following is a screenshot from my Genymotion emulator, showing the original Mat with green contours around blue detected blobs and then the submatrix I mentioned and then the histogram created by calcHist(), which is black vertical line The question is why is it like this, where is my histogram graph?

Code:
//Get the image from file path
            rgbaMat = new Mat();
            rgbaMatCopy = new Mat();
            rgbaMat = Highgui.imread(filePath);
            rgbaMatCopy = Highgui.imread(filePath);

            //Preprocessing - color space conversion
            Imgproc.cvtColor(rgbaMat, rgbaMat, Imgproc.COLOR_BGR2RGB);
            Imgproc.cvtColor(rgbaMatCopy, rgbaMatCopy, Imgproc.COLOR_BGR2RGB);
            Mat hsvMat = new Mat();
            Imgproc.cvtColor(rgbaMatCopy, hsvMat, Imgproc.COLOR_RGB2HSV);

            //Make the mask from the detected blue colored blob(s)
            Scalar lowerThreshold = new Scalar(100, 146, 148);
            Scalar upperThreshold = new Scalar(134, 255, 255);
            Mat mask = new Mat();
            Core.inRange(hsvMat, lowerThreshold, upperThreshold, mask);

            //Preprocessing
            Mat dilatedMask = new Mat();
            Imgproc.dilate(mask, dilatedMask, new Mat());
            Imgproc.dilate(dilatedMask, dilatedMask, new Mat());

            //Find the contours
            contours = new ArrayList<>();
            Imgproc.findContours(dilatedMask, contours, new Mat(), Imgproc.RETR_EXTERNAL, Imgproc.CHAIN_APPROX_SIMPLE);

            //Draw the contours
            for (int contourIdx = 0; contourIdx < contours.size(); contourIdx++) {
                Imgproc.drawContours(rgbaMatCopy, contours, contourIdx, new Scalar(0, 255, 0), 1);
            }

            //Convert the mat with contours drawn to bitmap and display in imageView
            Bitmap theBitmap = Bitmap.createBitmap(rgbaMatCopy.cols(), rgbaMatCopy.rows(),
                    Bitmap.Config.ARGB_8888);
            Utils.matToBitmap(rgbaMatCopy, theBitmap);
            imageView.setImageBitmap(theBitmap);

            //Find and cut out the smallest bounding rectangle around the first contour from the list of contours
            MatOfPoint firstContour = contours.get(0);
            Rect firstContourBoundingRect = Imgproc.boundingRect(firstContour);
            Mat objectSubmat = new Mat();
            objectSubmat = rgbaMat.submat(firstContourBoundingRect);

            Bitmap objectSubmatBitmap = Bitmap.createBitmap(objectSubmat.cols(), objectSubmat.rows(), Bitmap.Config.ARGB_8888);
            Utils.matToBitmap(objectSubmat, objectSubmatBitmap);
            imageViewOne.setImageBitmap(objectSubmatBitmap);

            //Create mask of the region inside the contour
            Mat regionMask = Mat.zeros(objectSubmat.rows(), objectSubmat.cols(), CvType.CV_8UC1);
            List<MatOfPoint> firstList = new ArrayList<MatOfPoint>();
            firstList.add(firstContour);
            Imgproc.drawContours(regionMask, firstList, 0, new Scalar(255), -1);

            //Preprocessing - color space conversion
            Mat regionHsv = new Mat();
            Imgproc.cvtColor(objectSubmat, regionHsv, Imgproc.COLOR_RGB2HSV);


            //Calculate Histogram
            List<Mat> sourceImageList = new ArrayList<Mat>();
            sourceImageList.add(regionHsv);
            Mat histogram = new Mat();
            //histogramMat.convertTo(histogramMat, CvType.CV_8UC2);
            Imgproc.calcHist(sourceImageList, new MatOfInt(2), regionMask, histogram, new MatOfInt(256),
                    new MatOfFloat(0f, 256f));


        Highgui.imwrite("/mnt/sdcard/histogram.bmp", histogram);// check
        Mat hish = Highgui.imread("/mnt/sdcard/histogram.bmp");
        Bitmap histogramBitmap =
                Bitmap.createBitmap(hish.cols(), hish.rows(), Bitmap.Config.ARGB_8888);
        Utils.matToBitmap(hish, histogramBitmap);
        imageViewTwo.setImageBitmap(histogramBitmap);

take a look at http://docs.opencv.org/3.1.0/d8/dbc/t... you should draw the histogram graph yourself
@sturkmen I am not able to understand step 5 in their explanation. How do they know that they have to use 512 and 400 as width and height values? Actually all steps after this one is confusing.
no spesific values for width and height. you can specify what you wish ( think if you give small values you get a small visualisation graph )
I am going to do some web search to understand those steps a bit better. If I still don't get it, I will post more specific questions. Thank you so much so far.
@sturkmen Thank you. I tried to write an Android version from the tutorial you pointed me too. But I am getting an here. If you have some time, could you have a look into my new question?
could you try the code here
@sturkmen That code is just like mine here in this question. But looking at the definition of
histPrepareImages()- the method in which I have got the error ofj < nimagesaccording the the OpenCV Error statement in logcat - given on line 115 of this class tells me thatnimagesis the second arg, which isnumberOfBinsin my code. So it means there is something with mynumOfBinsargument tocalcHist(). Can you look into Line 115 of that file and see what might have caused j to be less than numOfBins I passed and any hint on what is going wrong? I don't understand C++ or OpenCV well.