Line detection and tracking algorithm for autonomous robot.
Hi there!
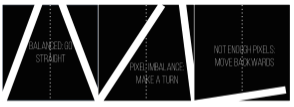
I am wokring on an autonomous robot which has to run in a lane 2m wide with a yellow line marking the outer boundary and white line marking the inner boundary. What I have thought of is, that I threshold the image to obtain a binary image containing the lines. Then divide that binary image into 2 parts vertically and then find out the non zero pixels in each part, the part with less pixels indicate that that the lane is turning, and hence the robot turns to the side of less pixels.
I'm trying to do something like this-
Problem is with all my opencv+python knowledge I am stuck at the stage where I threshold the image. I don't know how to proceed after that. I tried searching the documentary but I didn't find anything.
So how can I achieve this?
Thanks.
it probably helps, if you show your code (and maybe an example image)
@berak I was in the process of doing that :P My code is just the regular one used for thresholding, create trackbars, convert image to HSV and then threshold.
I can't tell what it is that you need help with. You say you don't know how to proceed, but you describe a perfectly fine way of doing it. Does it not work? Why not? Show us the code that isn't working.
@Tetragramm Actually, I don't know how do I split my binary image into 2 parts so that I can use np.count_nonzero to compare non zero pixels in each part
You need to familiarize yourself with the basic functions of the library. I would start HERE, since that page contains what you need.
@Tetragramm, I've been through the documentary for whole nights, and it helped me a lot, but it fails to answer several specific questions...
Well let's see, you want a range of columns from 0 to the number of columns/2 and the number of columns/2 to the number of columns.
The links go to the colRange method and the cols member variable. They're supposed to be direct links, but I'm told they don't always work. If this isn't enough, I don't think we can help you.
@Tetragramm I actually came up with another method to solve the problem. I used np.count_nonzero, and restricted the ROI to one half of the image, and thanks to @berak , it worked!
Now I have another question at hand, I have to track two lines, one white and one yellow, is it possible to extract both lines in one threshold?
Possibly, but it's a lot more reliable, and probably not much slower, to use two.