How to evaluate light linearity and additivity with a camera

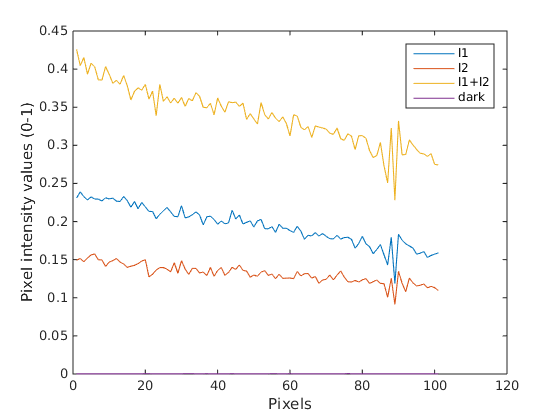
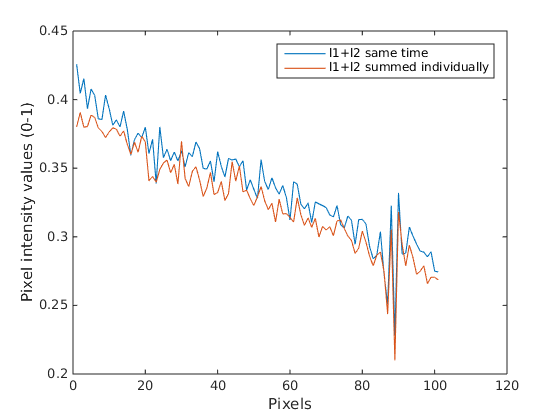
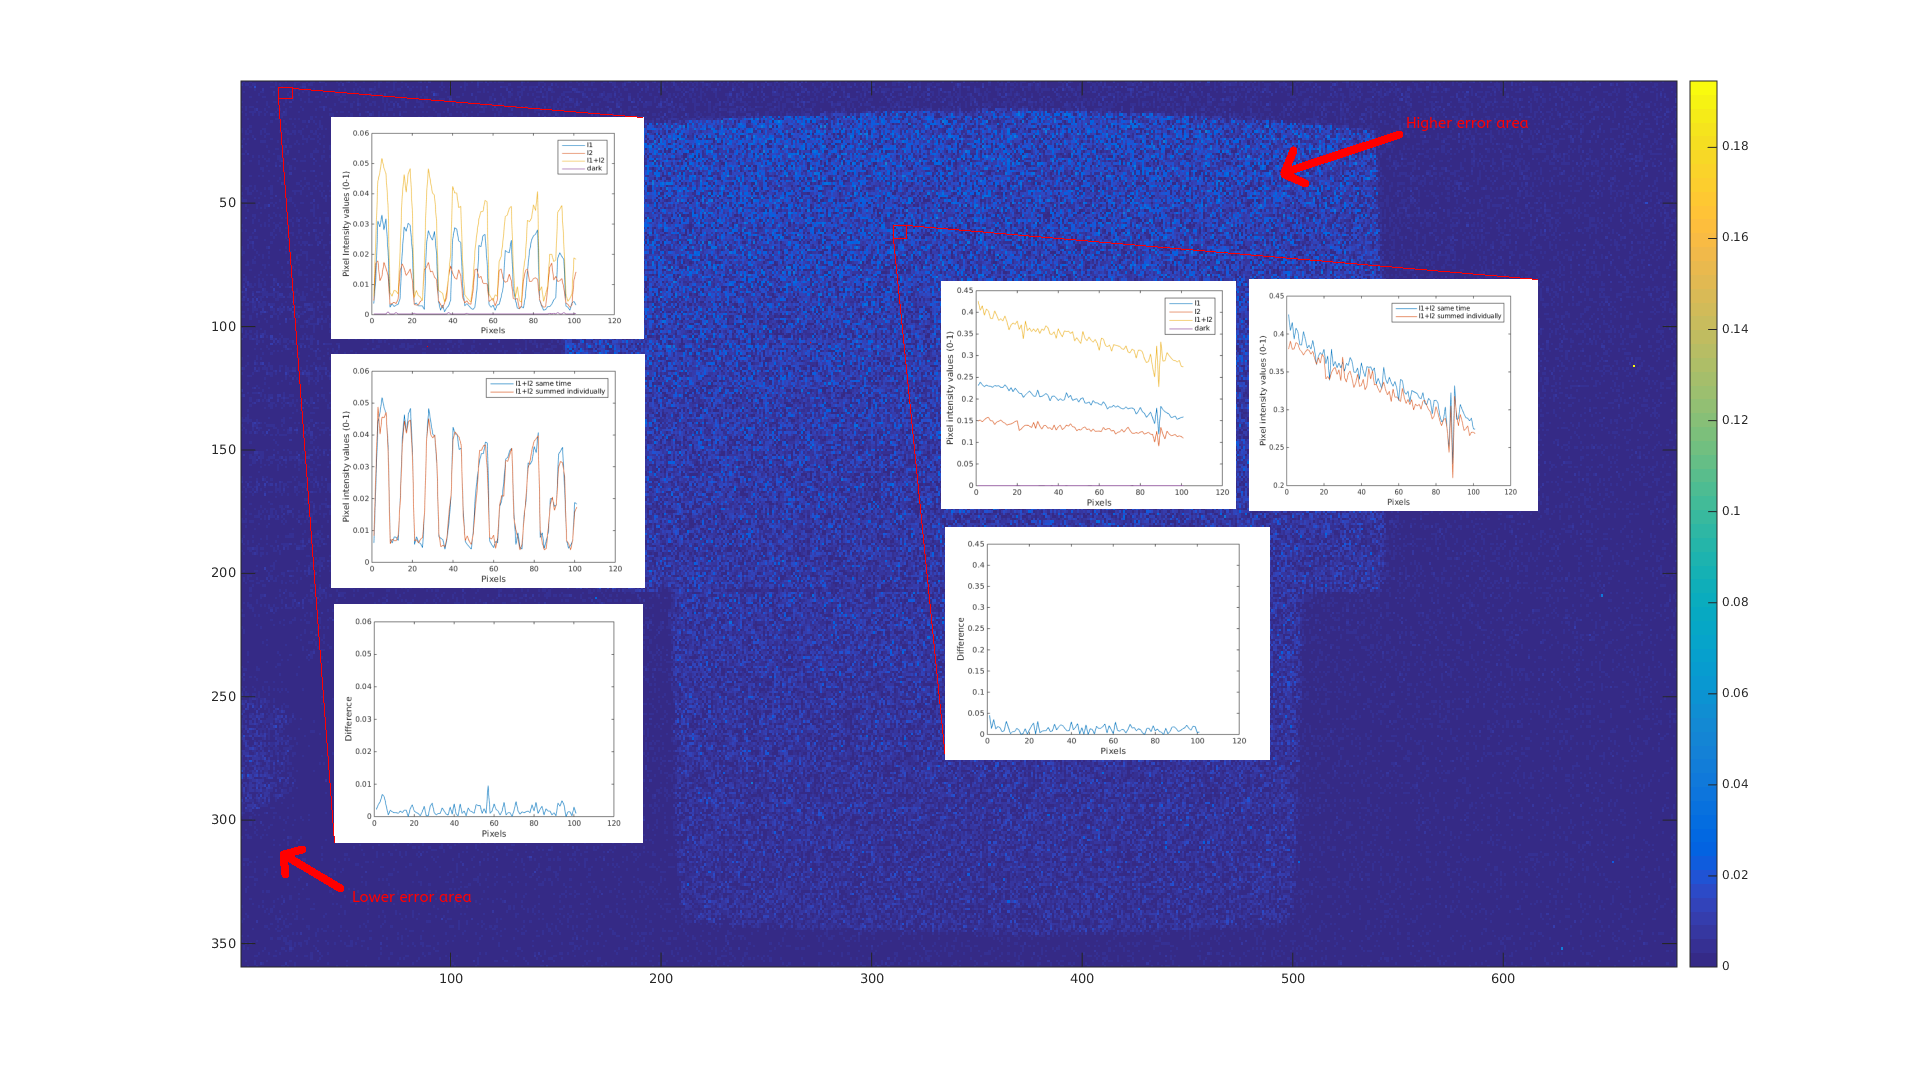
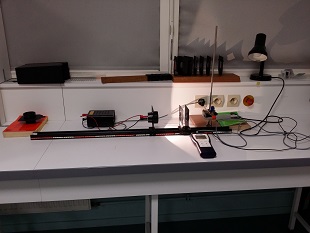
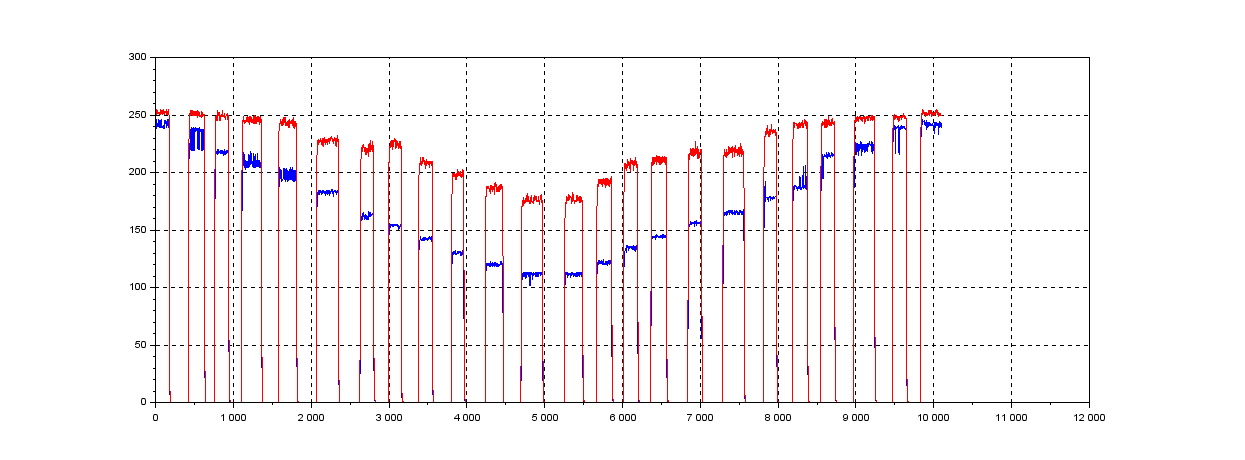
Hi, lastly I am questioning the linearity and additivity of light propagation in images. As the title says I would like to see what is the contribution of light to image pixel intensity values and if the linearity and additivity of light is a valid assumption to be done or not. For that reason I established the following experiment. Imagine a room , where I set up a camera in top view (i.e. birds eye view) with two light sources of same type and light installed on two of the room corners. Then I took some images where the room was dark, i.e. light sources switched off (really hard to achieve that in reality since always there is gonna be a kind of light that the camera sensor can receive, but lets consider that I managed to do that), then only the first light source was switched on, then only the second light source was switched on and finally when both lights were switched on. These images were captured in rgb 8-bit depth (normal images normal images that can be acquired with a cheap camera sensor) with auto-setting fixed (i.e. exposure, gain, white-balance, etc...). Then I took 500 pixels and plotted their pixel intensity values for a case of one light source, second light source, both light sources and dark:
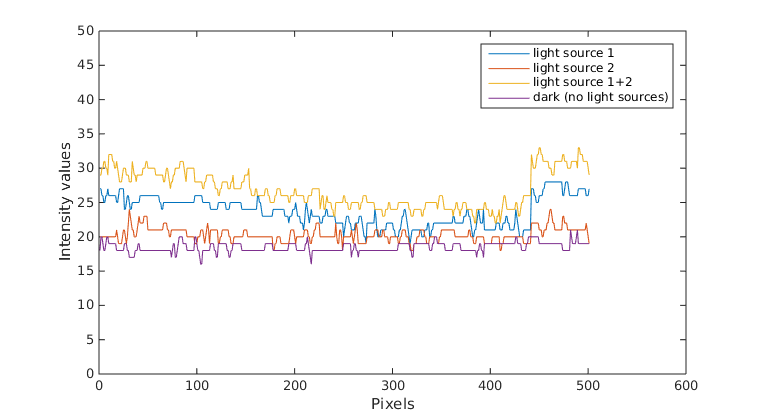
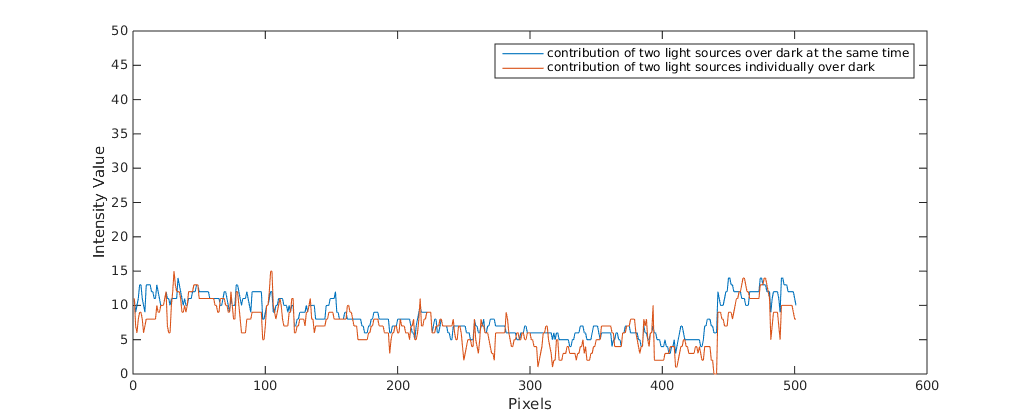
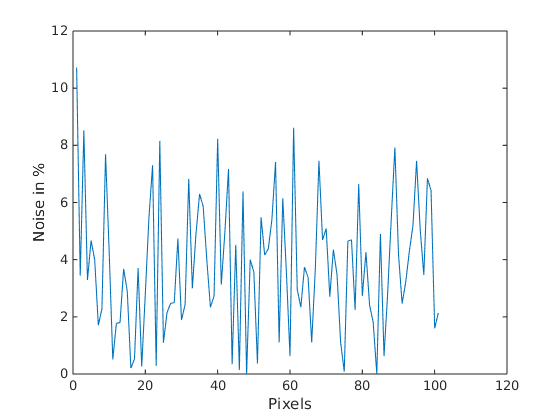
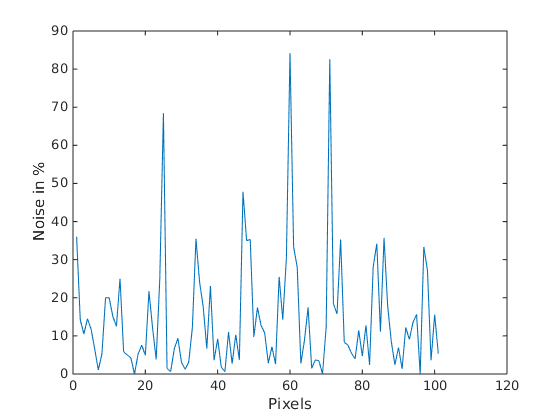
from the above image what you can observe is that I have a lot of noise when the lights are off (purple graph, ideally this should be close to zero). Then if we consider that the light works additive (in the simpler case) then the yellow graph should be as much higher from the blue graph as the blue from the orange graph respectively (again this in the ideal case). However, it is not you can see that in the plot below:
what you see here is
blue graph = yellow - purple (from the first graph)
orange graph = (blue - purple) + (orange - purple)
and these two ideally should be equal if additivity was the case, however we can say that they have a kind of similar pattern. However, it is obvious that what I am doing is not working. Then I searched a bit further and I found this discussion here. Apparently in order to see such a behaviour I need a better camera and to capture pixels values in raw format and in higher bit-depth. To be honest I am not sure if what I am doing makes sense, also I guess that beforehand I need a light calibration procedure with which I am not also familiar. Therefore, my question is if someone has any experience on how to check the above.
@pklab I know that you are working with different camera setups, so I do not know if you have some experience in such a subject. If you have I would be glad to hear any suggestions. Of course anyone that might have a clue is welcome to contribute to the discussion.
Thanks.
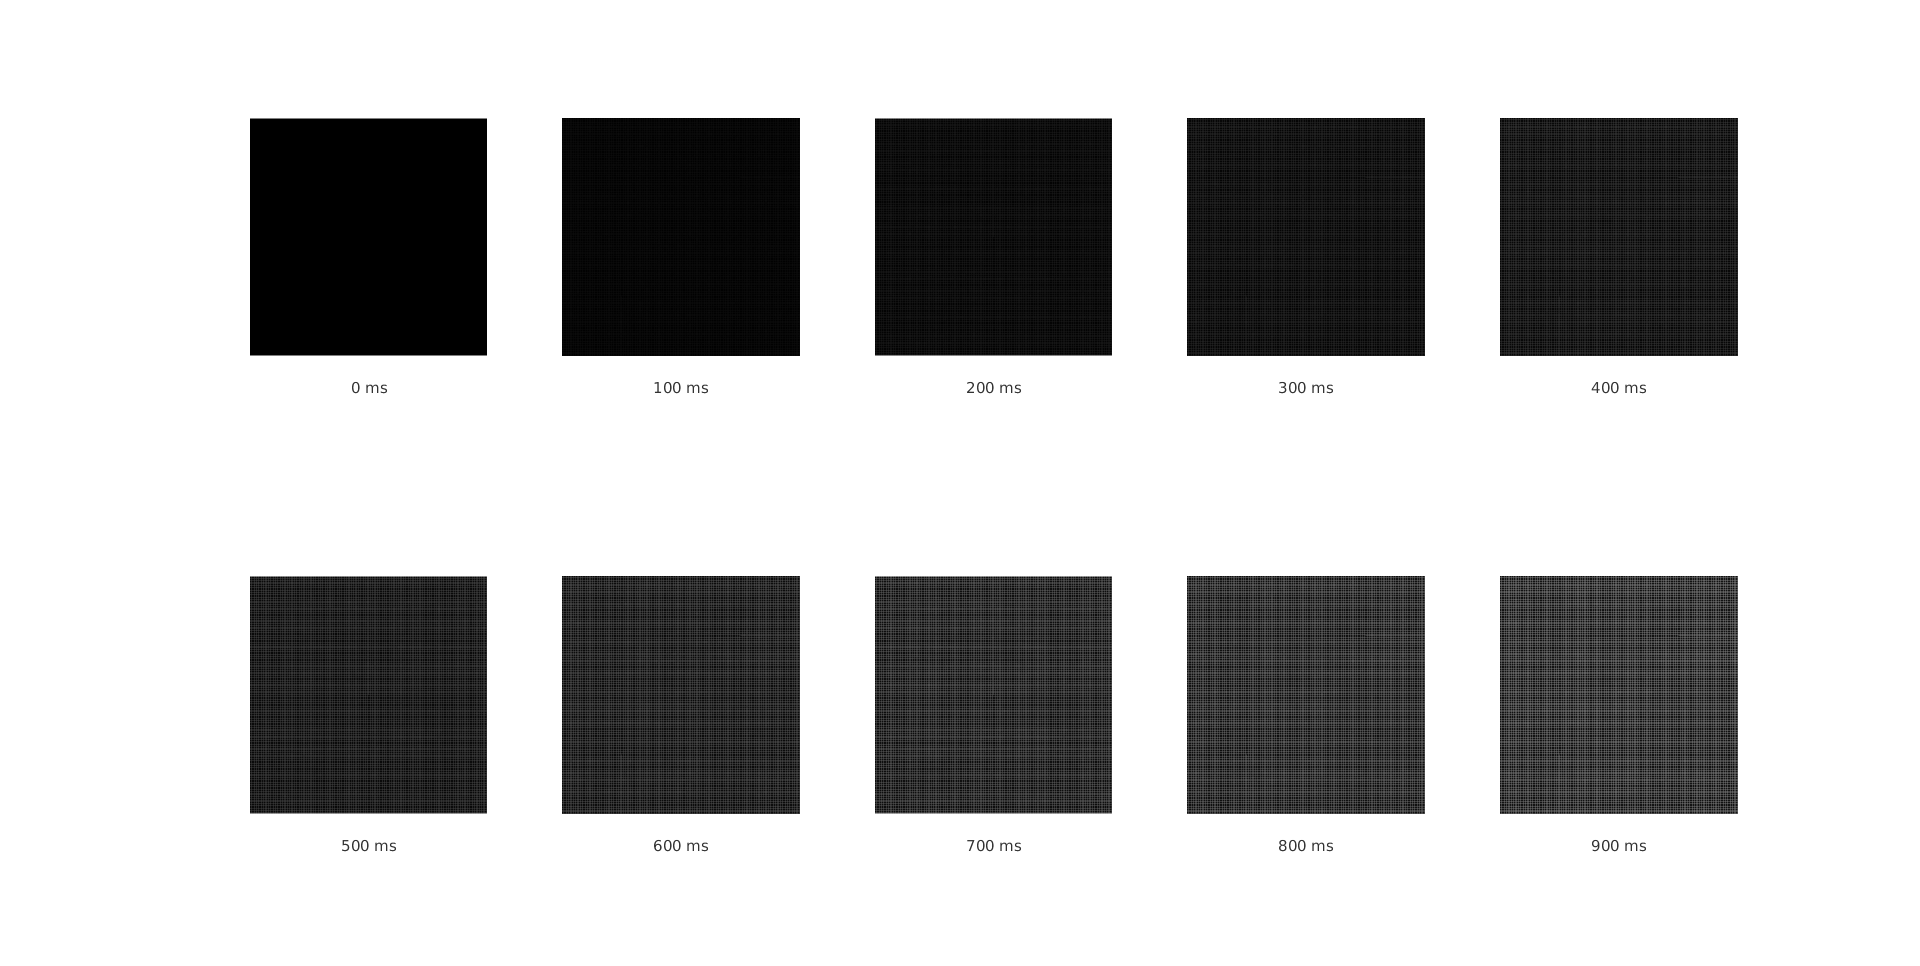
Update:
Ok, I did another ...


That's not opencv! But it is an interesting problem. You can find many technical defintion using keyword Quantum efficiency (andor website is a good example). About your curve I cannot explain your result except if you have an autoadjust gain. There is some linearity but I don't think it is your case even if you don't cool your ccd...
Finally I'm not sure. Can you use a butterworth filter to reduce noise?
Some smartphone got a luxmeter
@LBerger, yes it is not 100 % opencv but more image processing related subject. If the moderators think that it is not relevant, they can close the thread. Which curve do you refer to? Gain was fixed as well during the recording.
Finally source 1+ source 2 =source 1 and 2 additivity is quite good. You have to reduce noise measurement (first graph). As your signal is same order than noise last graph is not so bad.
If you don't want t use a butterwort filter you can use mean with 500 pixels
I agree LBerger. I think you should try the experiments first with stronger light sources. With a high SNR, I don't think you'll get representative results.
In camera image preprocessing also applies some gamma filtering, so results won't be completely linear.
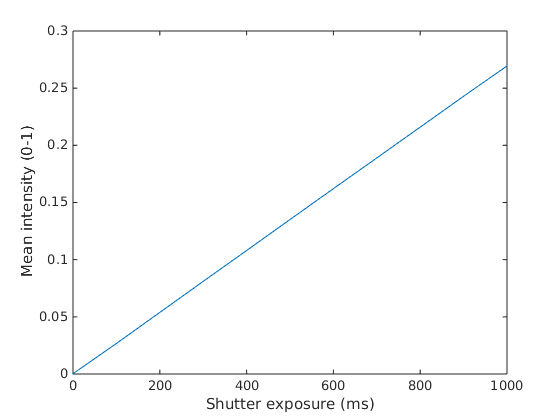
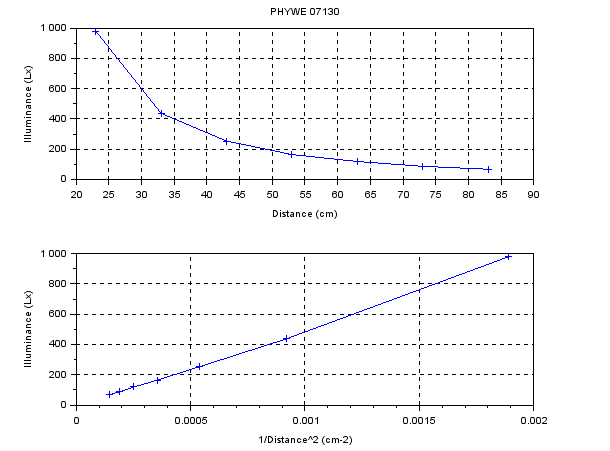
thank you both @LBerger and @kbarni, but what if I capture raw format information in bayer or YUV with hight bit-depth. Moreover, how can noise be reduced? intereflections and a little light will always be around (you cannot really achieve total dark, except if you have these clean rooms or under a really controlled environment). Moreover, if we say that the graphs above they kind of show some linearity behaviour. I tried to solve a simple least square linearity problem (I will give some updates tomorrow) where for sure I cannot see any linearity behaviour.
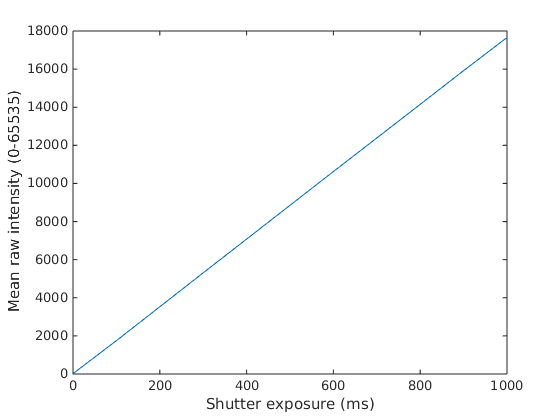
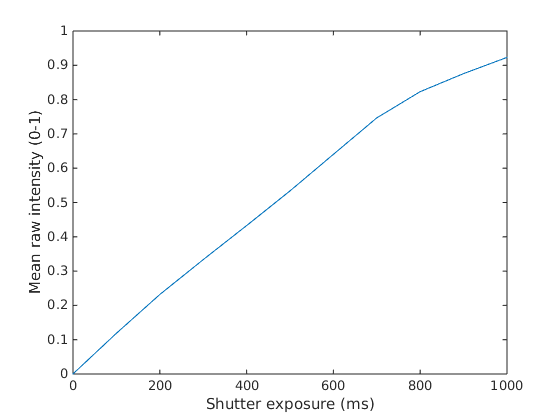
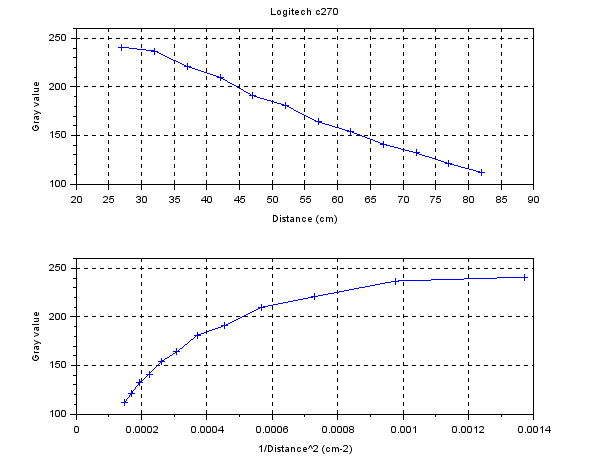
About the second experiments: I think the system is not linear but logarithmic (just like the sound). In fact the 1.44 is quite close to sqrt(2).
@kbarni yes you are right, that was my exact thought. So, then based on my second experiment what I get from the first experiment with the pixel values it makes sense not to show any linearity, right? Since it seems that the pixel values somehow are processed logarithmically and they are not in their actual raw format. Moreover, then comes the other question how to show the linearity of the light over the images.
What kind of light do you use?
it is actually these bulbs.
Ok it is an alternative light. Have you got a webcam with a framerate 200Hz to check if intensity is constant.