coefficients clustering

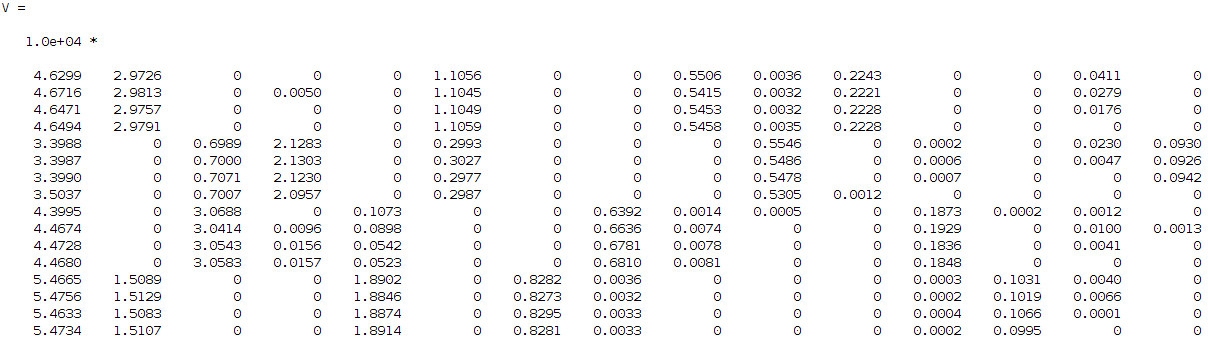
Hi guys, well my problem is not exactly opencv related but more statistical/image processing wise, I hope therefore that there isn't a problem adding it in this forum. Otherwise, the mods feel free to remove it. So let's say that I have some signals that want to identify. I have a kind of dataset of 16 images (lets keep it simple for now) describing 4 different use cases each case is described by 4 images (i.e. 4 use cases X 4 images for each case = 16 images in total). On these 16 images I am applying a kind non negative factorization (a technique similar to PCA, SVD, etc... but with the advantage of dealing only with positive values which is supposed it is easier to work with and since in my problem the input signals are additive it makes sense to use it instead of the other techniques). From this technique I am getting two approximation matrices W and H where WxH should give me approximately the original input images. Briefly the W describes the basis and H the coefficients/weights. In my case I asked the algorithm to decompose my input dataset into 15 components, this gives me the following H matrix:
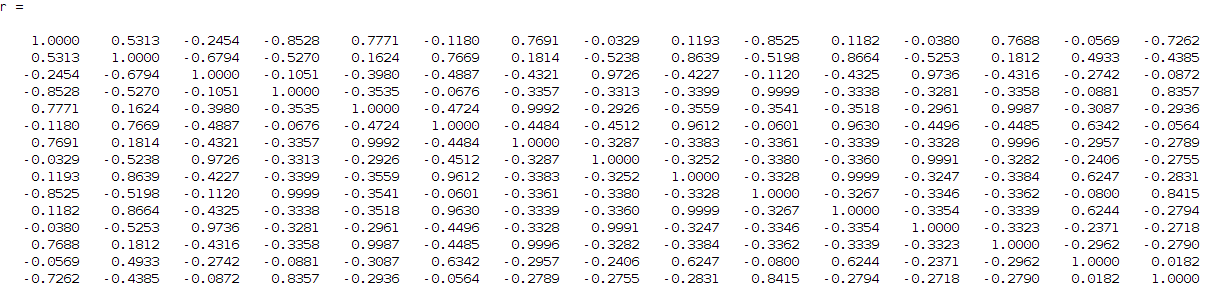
I then tried to find the correlation between these components to each other since I want from 15 to find 4 (this is my input number of signals if you remember that I want to identify). So, I need to find the 4 strongest combinations from the 15 components that describe me better my 4 signals. For that reason I run a correlation coefficient method based on the Pearson's linear correlation coefficient approach, where it gives me the correlation of the input data with a distance measurement between 1 and -1, values close to 1 show high correlation while close to -1 low correlation. The extracted correlation matrix is the following:
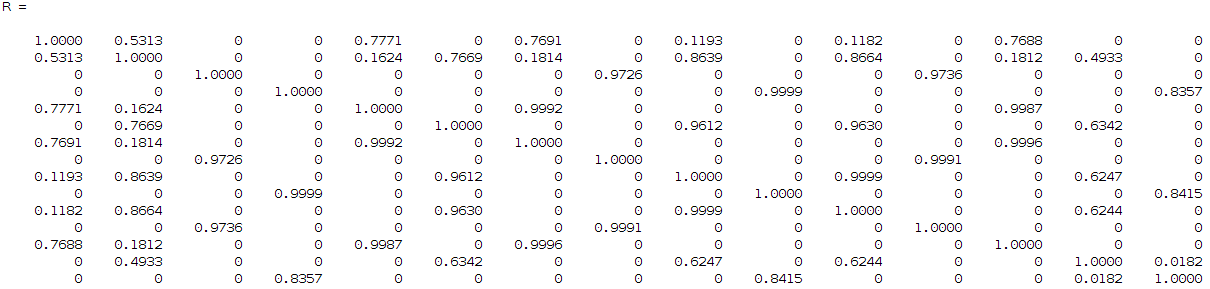
removing the low correlation values, the above matrix can be transformed into:
The latter matrix can be translated in a more understanding visual output by sorting the correlation values row-wise and keeping the original indices. This leads to two new matrices as below:
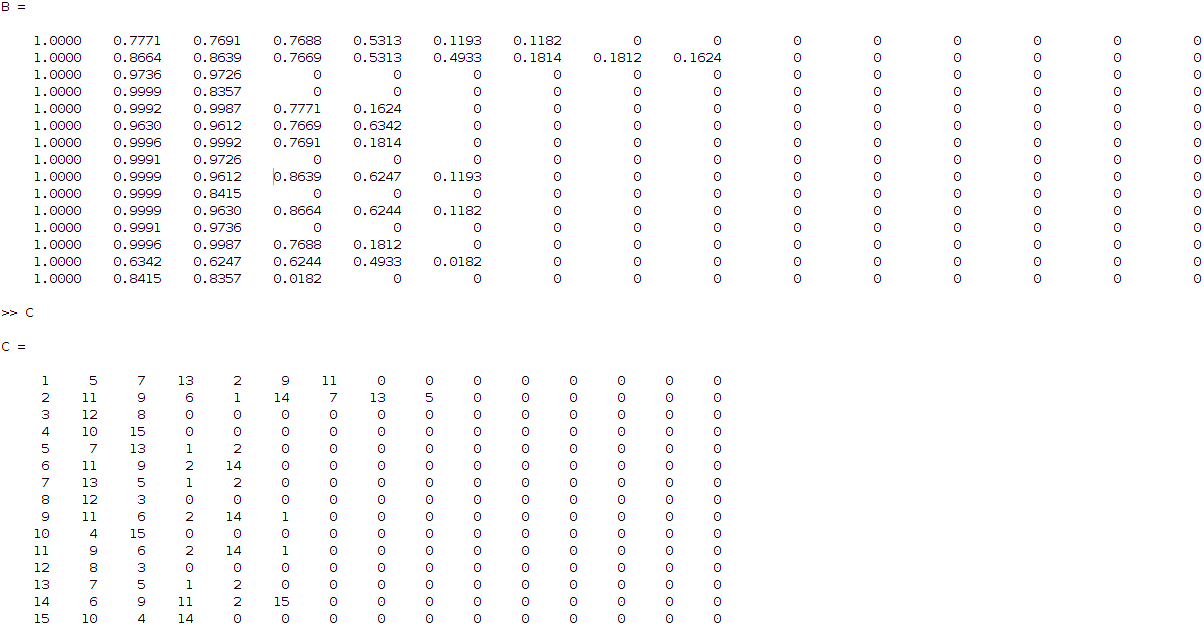
So, what these matrices are telling me (read it row wise), is that for example coefficient 3 is related to 12 and 8 (matrix C, third row) with correlation ratios 0.9736 and 0.9726 respectively (matrix B, third row) and so on. Having this then applying some hierarchical clustering based on Jaccard similarity distance, I get the following clustering result:
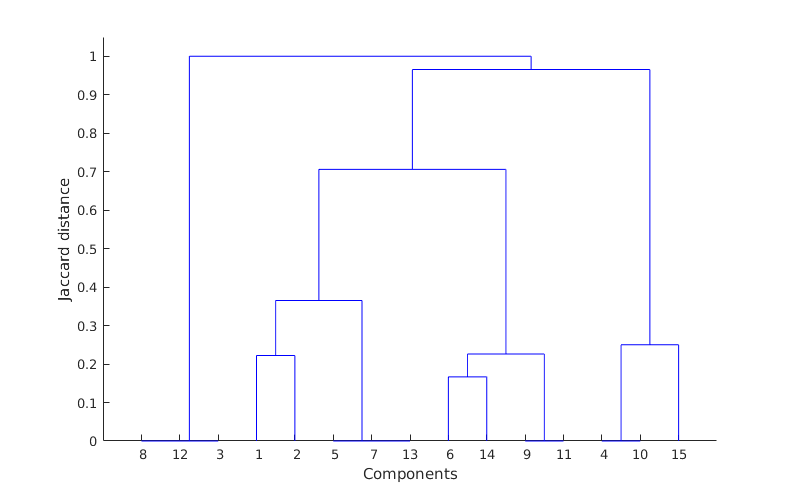
where as you can see it is obvious that my clusters are 8-12-3, 1-2-5-7-13, 6-14-9-11 and 4-10-15 however, there is a mistake here because component 2 should be included also in cluster 6-14-9-11 according to the matrix C (I do not know though if I am reading the dendrogram wrongly?). Also verifying this by obtaining the residual error of the clustered components against the corresponding input images shows this as well. So, from what I ...