displaying histogram model space
i'm just writing up my dissertation which is based on bag of visual words classification and was looking to find a way to effectively visualise the separate model spaces and ideally how the interact and effect on interclass distance when new images/classes are added. To give you some details the models are histograms with approximately 100 bins and i have 8 classes so 8 dimensions?. Each 8 classes has between 8 and 40 models each comprising 10 cluster centers.
The first option was a density histogram, aggregating all of the histograms for each class and drawing trend curve, then displaying them together similar to this: 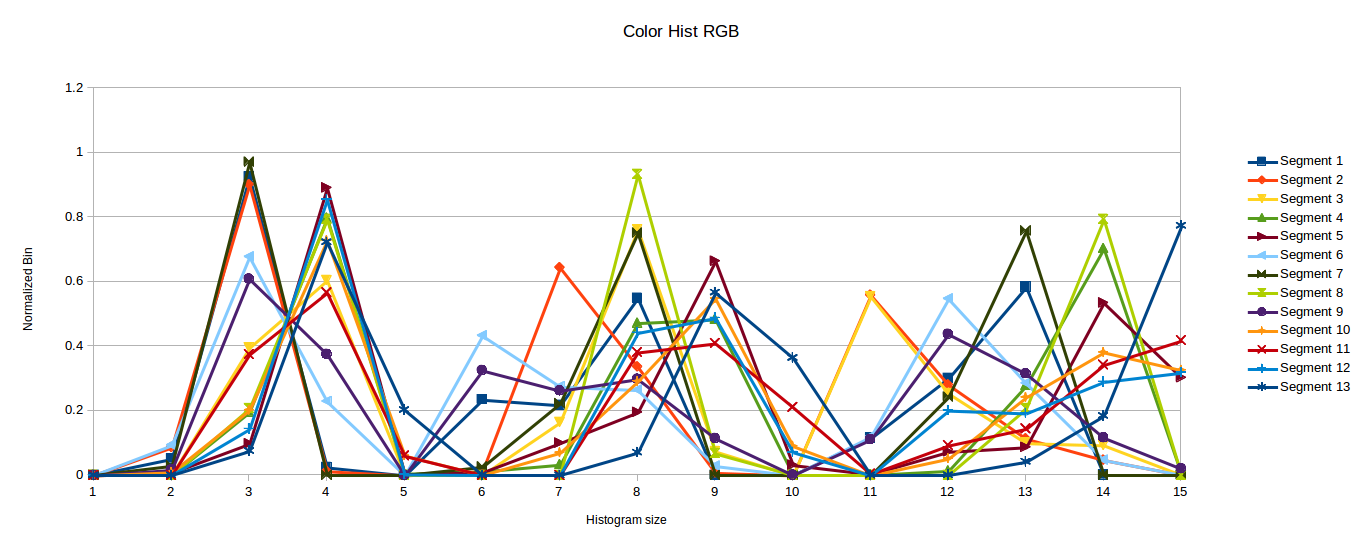
To me this looks clutered though and doesn't really show the interaction.
So i though of again aggregating the bin counts and displaying them stacked on their own horiztonal line like this:
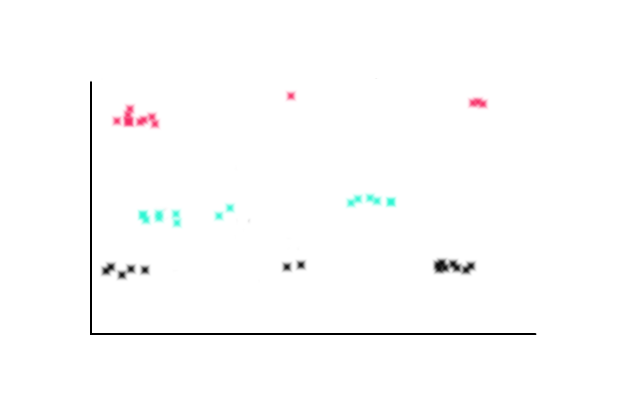
I think that could display the information with less clutter but was looking for something more descriptive. Like a 2d histogram of scatter plot as below:
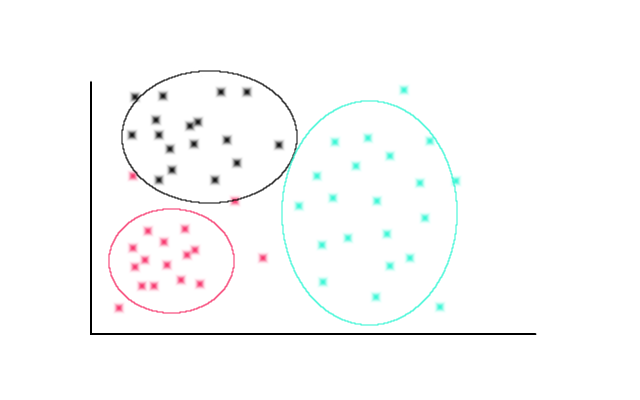
I'm not sure however how to represent it in this space or what the y axis would be. Does anyone know of anything like this or any other ways to represent a model feature space? Also is there anyway to do the required calculations outside of opencv like in libre office as that's where i'm going through the data.
Thanks