Ask Your Question
0

Redrawing the grayscale histogram to have more normalize

asked 2015-07-13 22:37:40 -0600

zms gravatar image

updated 2015-07-13 22:44:30 -0600

Hi, 
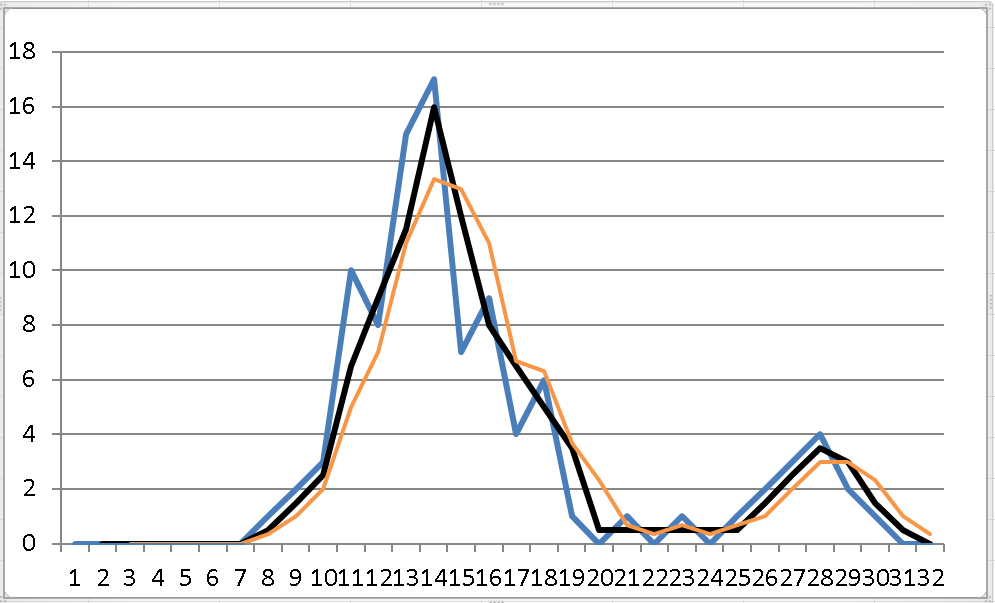
I had done the calculation on the grayscale histogram and expected two distinct peak. From the histogram, it does not so smooth so I could not locate both distinct peaks effectively. What I want to try is to redraw it to better bell curve with distinct two peaks. 1) Is it anyway that I can do the redrawing? 2) If YES, how the two peak can be distinctively detected?C:\fakepath\Redrawing the histogram.png
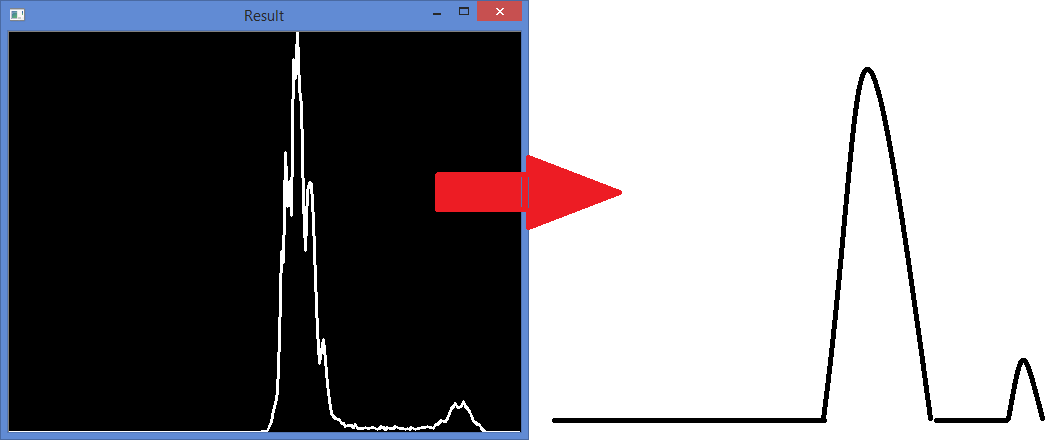
(/upfiles/14368450047532521.png)Thanks

edit retag flag offensive close merge delete

1 answer

Sort by ยป oldest newest most voted
1

answered 2015-07-14 01:56:50 -0600

First thing you can do is a simple moving average filter. A moving average is commonly used with time series data to smooth out short-term fluctuations and highlight longer-term trends or cycles (Moving average)

For example:

0 0 0 0 0 0 0 1 2 3 10 8 15 17 7 9 4 6 1 0 1 0 1 0 1 2 3 4 2 1 0 0

These values and the MA = 2 and the MA = 3 are shown in the same image.

image description

edit flag offensive delete link more

Comments

Hi thanks for the knowledge! :)

zms gravatar imagezms ( 2015-07-14 23:40:49 -0600 )edit

Question Tools

1 follower

Stats

Asked: 2015-07-13 22:37:40 -0600

Seen: 538 times

Last updated: Jul 14 '15