Ask Your Question
0

How to recognize line charts

asked 2014-10-14 06:15:26 -0600

tlearner gravatar image

First of all I am beginner on this field and hoping to get help from you.

I would like to recognize line chart and get (x,y) values from chart into excel. 
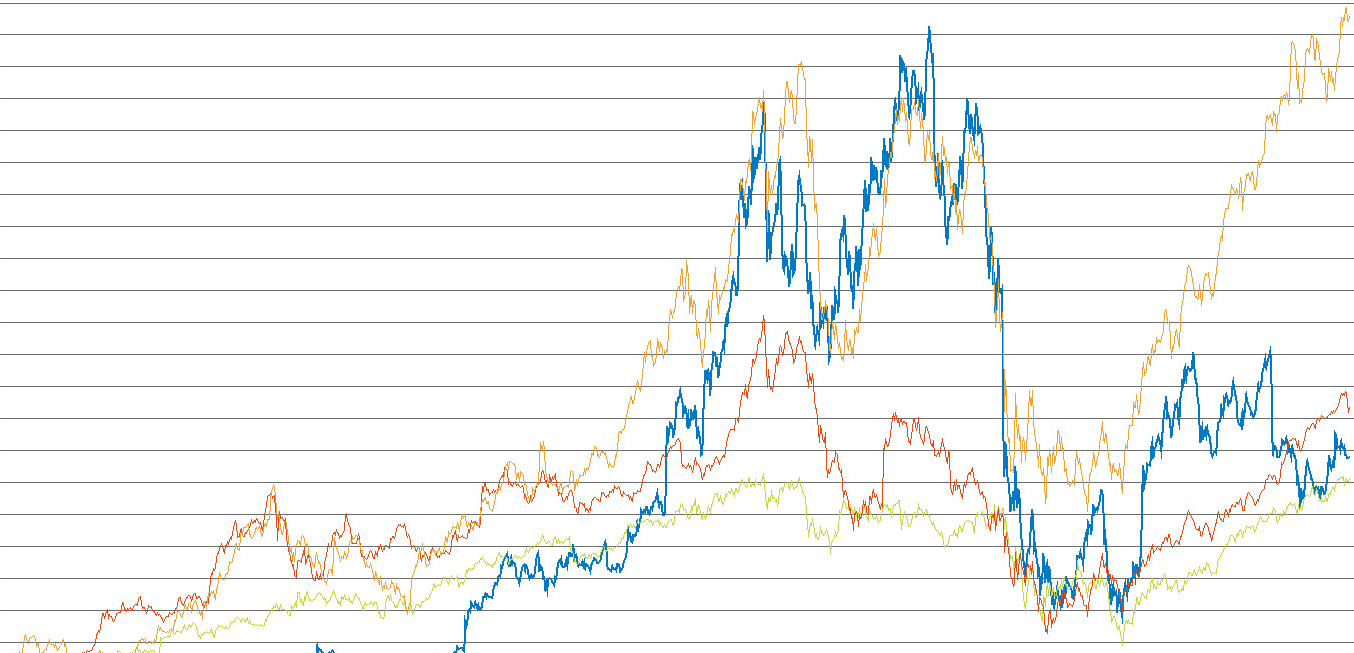
Charts could look like this.
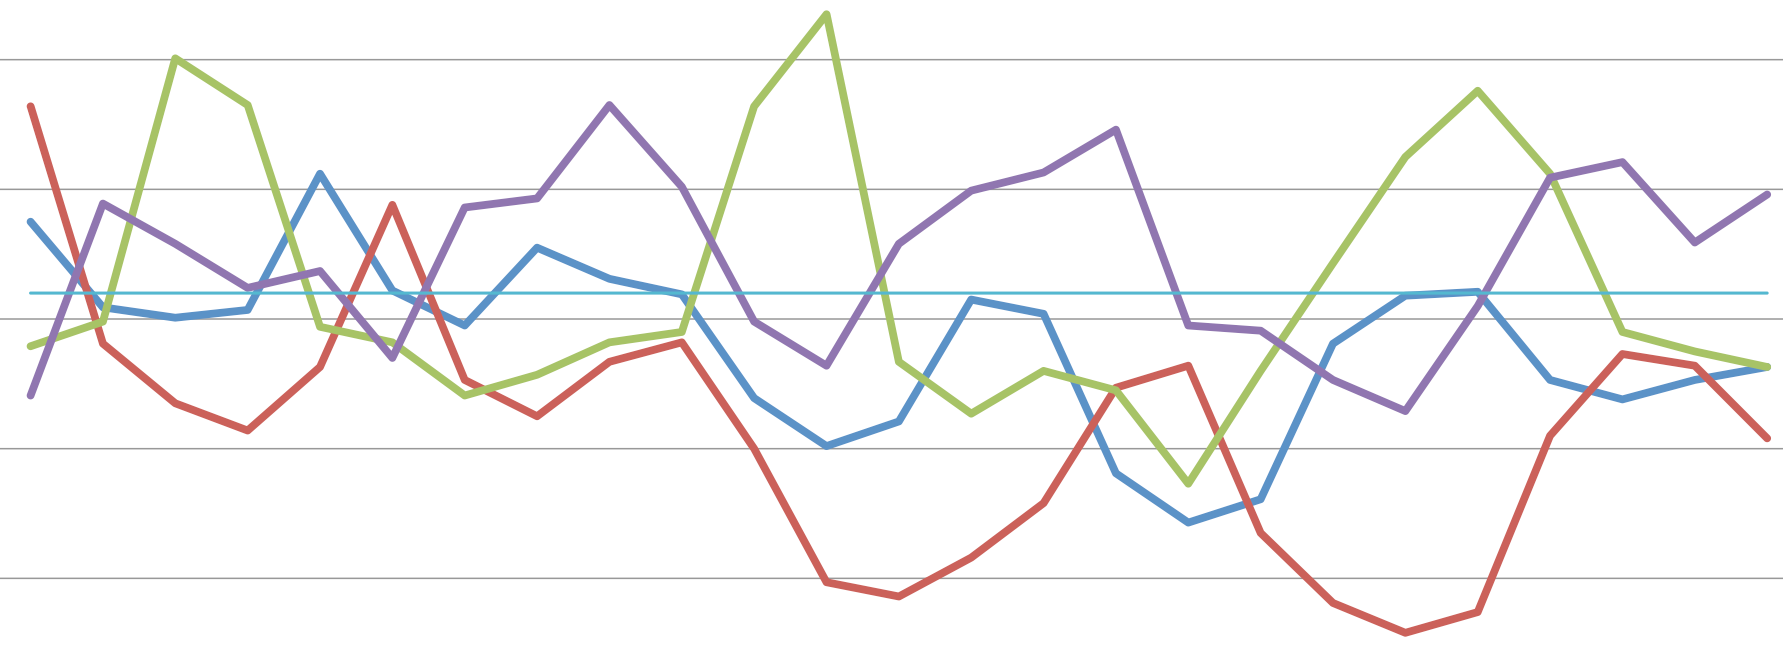
 image description

or like this

image description

Charts are in cartesian coordinate. I have checked this. But couldnt understand all the logic fully and feels like it's little outdated. Could you please describe the steps, papers, algorithms and/or specific modules from OpenCV which I should read in order to accomplish my task. Please let me know if I should add specific details.

edit retag flag offensive close merge delete

1 answer

Sort by ยป oldest newest most voted
3

answered 2014-10-14 10:59:56 -0600

Haris gravatar image

You can proceed like,

  1. Convert source to hsv color space using cvtColor().

  2. Now segment each line using inRange(), here you should give appropriate hsv color range each line in your chart.

  3. The inRange() result will give you binary image for each line. You may need to apply morphology as most of the lines in the chart lies on one another.

  4. Finally find contour will give you x-y co-ordinates for each line segment for the input binary.

edit flag offensive delete link more

Comments

2

Thanks for your helpful insights, I will try to use this method, will mark answer as correct when I obtain even some small success, great thanks!

tlearner gravatar imagetlearner ( 2014-10-14 11:45:06 -0600 )edit

You are welcome, and if you stuck somewhere let me know.

Haris gravatar imageHaris ( 2014-10-14 21:04:31 -0600 )edit

Question Tools

Stats

Asked: 2014-10-14 06:15:26 -0600

Seen: 1,112 times

Last updated: Oct 14 '14