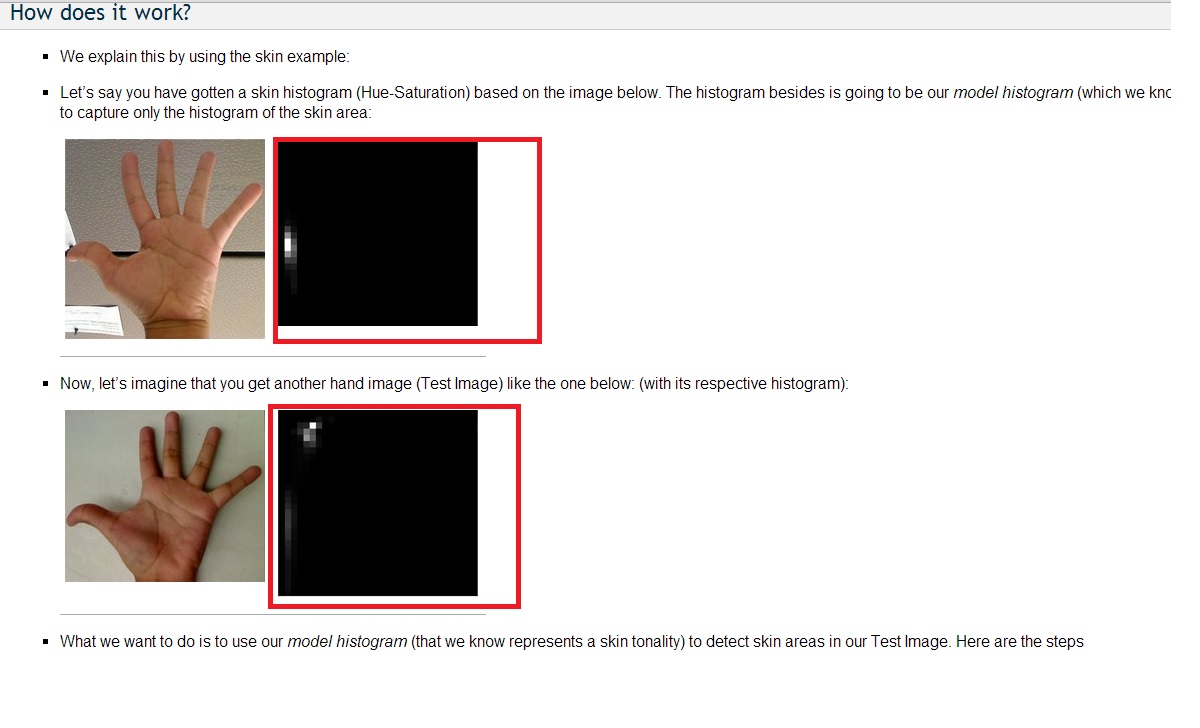
Backprojection and 2D histogram
 Hello !
can anyone please tell me how to draw the images in the red rectangles ?
is it true that the X axis is SAT and the Y axis is HUE ?
is it a 2D histogram ?
thanks
Asked: 2014-04-15 19:58:52 -0600
Seen: 205 times
Last updated: Apr 15 '14
yes, that looks like a 2d histogram. but since skin-hue is usually in the low (0-60) range, i'd say x is hue and y is sat (also the shape of the rectangle gives it away: h[0..180], s[0..256])