How to plot histogram of an area inside a contour [closed]
Hi,
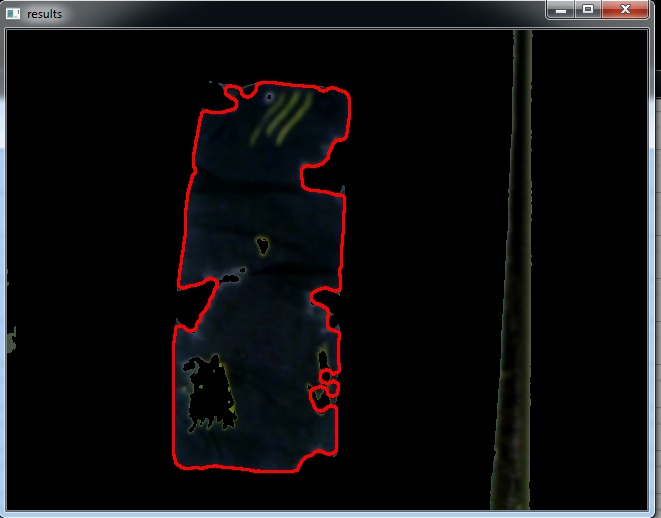
i am using OpenCV and python. i can find the biggest contour
 i need histogram of this area. i tried this
 for c in cntrs:
        area = cv2.contourArea(c)
        if area > area_thresh:
            area = area_thresh
            big_contour = c
        if cntrs != None:
            results = fg.copy() #draw the contour on a copy of the input image
            cv2.drawContours(results,[big_contour],0,(0,0,255),2) # 2 is thickness
            cv2.imshow('results', results)

       hist_item = cv2.calcHist([results],[cntrs],big_contour,[256],[0,255])
i see this error message: <built-in function calcHist> returned NULL without setting an error
what's your problem, exactly ? getting the area inside the contour ?
https://docs.opencv.org/master/de/db2...
yes getting the area inside the contour, and plot the histogram of that area
ton of things wrong here:
big_contour = chas to go out of the for - loopyou can try to fill the outside of the contour with e.g. black, and then take the histogram