i want to output coordinates.

hi all
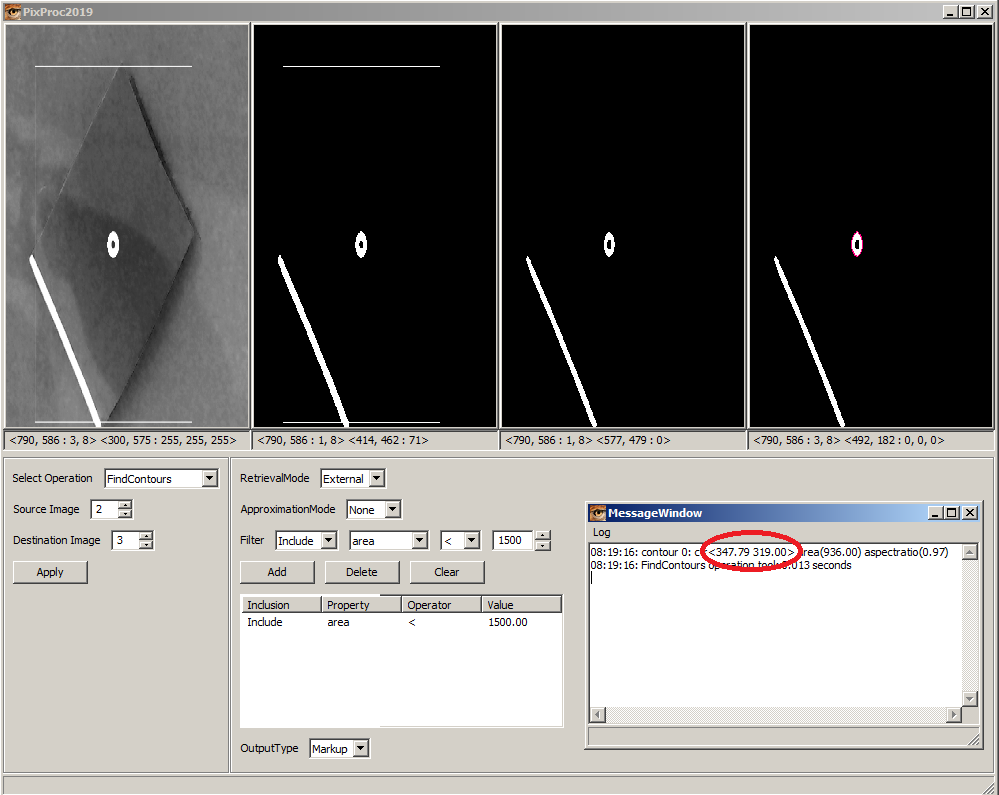
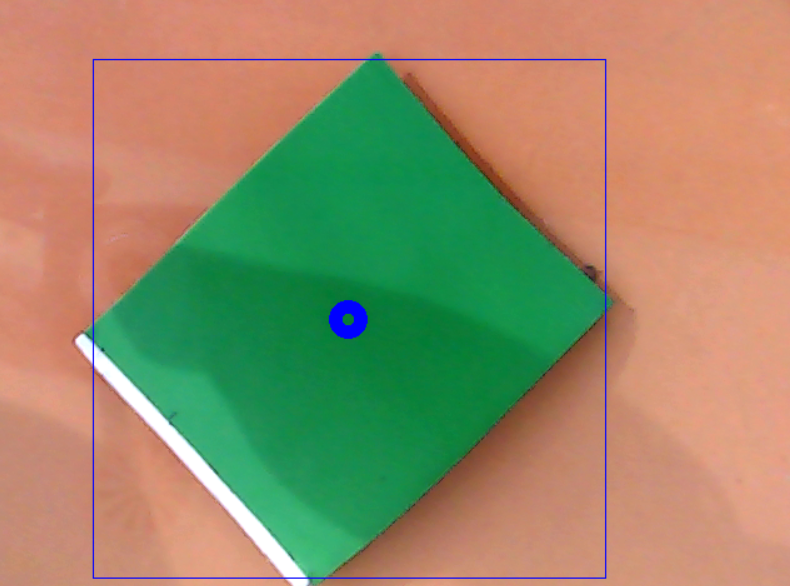
i want to output blue circle and red circle's coordinates. (just (x, y) )
but i don't know how. :(
how to get coordinates?
I've already made tracking objects according to color. But I want to create coordinates for the object that I'm tracking
this is my code
import cv2 as cv
import numpy as np


color1 = 0
color2 = 0

ranges = 20
set_color = False
step = 0


def nothing(x):
    global color1, color2
    global lower_blueA1, lower_blueA2, lower_blueA3
    global upper_blueA1, upper_blueA2, upper_blueA3
    global lower_blueB1, lower_blueB2, lower_blueB3
    global upper_blueB1, upper_blueB2, upper_blueB3

    saturation_th1 = cv.getTrackbarPos('saturation_th1', 'img_result')
    value_th1 = cv.getTrackbarPos('value_th1', 'img_result')

    saturation_th2 = cv.getTrackbarPos('saturation_th2', 'img_result')
    value_th2 = cv.getTrackbarPos('value_th2', 'img_result')

    color1 = int(color1)
    color2 = int(color2)

    # HSV 색공간에서 마우스 클릭으로 얻은 픽셀값과 유사한 필셀값의 범위를 정합니다.
    if color1 < ranges:
        lower_blueA1 = np.array([color1 - ranges + 180, saturation_th1, value_th1])
        upper_blueA1 = np.array([180, 255, 255])
        lower_blueA2 = np.array([0, saturation_th1, value_th1])
        upper_blueA2 = np.array([color1, 255, 255])
        lower_blueA3 = np.array([color1, saturation_th1, value_th1])
        upper_blueA3 = np.array([color1 + ranges, 255, 255])
        #     print(i-range+180, 180, 0, i)
        #     print(i, i+range)

    elif color1 > 180 - ranges:
        lower_blueA1 = np.array([color1, saturation_th1, value_th1])
        upper_blueA1 = np.array([180, 255, 255])
        lower_blueA2 = np.array([0, saturation_th1, value_th1])
        upper_blueA2 = np.array([color1 + ranges - 180, 255, 255])
        lower_blueA3 = np.array([color1 - ranges, saturation_th1, value_th1])
        upper_blueA3 = np.array([color1, 255, 255])
        #     print(i, 180, 0, i+range-180)
        #     print(i-range, i)
    else:
        lower_blueA1 = np.array([color1, saturation_th1, value_th1])
        upper_blueA1 = np.array([color1 + ranges, 255, 255])
        lower_blueA2 = np.array([color1 - ranges, saturation_th1, value_th1])
        upper_blueA2 = np.array([color1, 255, 255])
        lower_blueA3 = np.array([color1 - ranges, saturation_th1, value_th1])
        upper_blueA3 = np.array([color1, 255, 255])
        #     print(i, i+range)
        #     print(i-range, i)


    if color2 < ranges:
        lower_blueB1 = np.array([color2 - ranges + 180, saturation_th2, value_th2])
        upper_blueB1 = np.array([180, 255, 255])
        lower_blueB2 = np.array([0, saturation_th2, value_th2])
        upper_blueB2 = np.array([color2, 255, 255])
        lower_blueB3 = np.array([color2, saturation_th2, value_th2])
        upper_blueB3 = np.array([color2 + ranges, 255, 255])
        #     print(i-range+180, 180, 0, i)
        #     print(i, i+range)

    elif color2 > 180 - ranges:
        lower_blueB1 = np.array([color2, saturation_th2, value_th2])
        upper_blueB1 = np.array([180, 255, 255])
        lower_blueB2 = np.array([0, saturation_th2, value_th2])
        upper_blueB2 = np.array([color2 + ranges - 180, 255, 255])
        lower_blueB3 = np.array([color2 - ranges, saturation_th2, value_th2])
        upper_blueB3 = np.array([color2, 255, 255])
        #     print(i, 180, 0, i+range-180)
        #     print(i-range, i)
    else:
        lower_blueB1 = np.array([color2, saturation_th2, value_th2])
        upper_blueB1 = np.array([color2 + ranges, 255, 255])
        lower_blueB2 = np.array([color2 - ranges, saturation_th2, value_th2])
        upper_blueB2 = np.array([color2, 255, 255])
        lower_blueB3 = np.array([color2 - ranges, saturation_th2, value_th2])
        upper_blueB3 = np.array([color2, 255, 255])
        #     print(i, i+range)
        #     print(i-range, i)


cv.namedWindow('img_color')
cv.namedWindow('img_result')

cv.createTrackbar('saturation_th1', 'img_result', 0, 255, nothing)
cv.setTrackbarPos('saturation_th1', 'img_result', 30)
cv.createTrackbar('value_th1', 'img_result', 0, 255, nothing)
cv.setTrackbarPos('value_th1', 'img_result', 30)
cv.createTrackbar('saturation_th2', 'img_result', 0, 255, nothing)
cv.setTrackbarPos('saturation_th2', 'img_result', 30)
cv.createTrackbar('value_th2', 'img_result', 0, 255, nothing)
cv.setTrackbarPos('value_th2', 'img_result', 30)

cap = cv.VideoCapture(1)


while(True):

ret,img_color ...add a comment