Ask Your Question
0

python: how to compute the gray level histogram features as mentioned in the paper

asked 2019-01-07 03:06:32 -0600

bubu_ka gravatar image

updated 2019-01-07 03:17:49 -0600

berak gravatar image

Hi I am extracting the grey level features of image mentioned in the following paper: part 4.5 low level features: https://www.cs.cmu.edu/~yke/photoqual...

We describe two low level features that are particu- larly important for photo quality assessment – contrast and brightness. Professional photos usually have higher contrast than snapshots. We measure the contrast of an image as fol- lows. First, we compute the gray level histogram Hr , Hg , and Hb for each of the red, green, and blue channels, re- spectively. Then, we compute the combined histogram H, where

image description

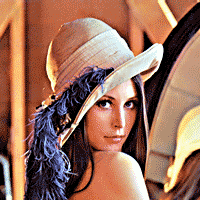
I can't clearly understand the above part in the paper. As my understanding about grey level features, take the above image as example. Use the opencv convert the color image to grey image. as the following code:

image = cv2.imread('lenna.png') gray = cv2.cvtColor(image, cv2.COLOR_BGR2GRAY)

image description

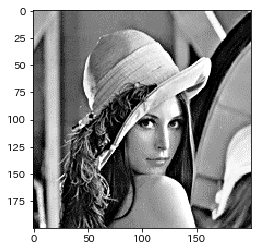
and then using the following code to get the histogram with the following code:

hist = cv2.calcHist([gray], [0], None, [256], [0,255])

I want to ask, and I don't know the meaning of gray level histogram for each channel.

(1) how to we compute the gray level histogram Hr , Hg , and Hb for each of the red, green, and blue channels.

(2) how to compute the the contrast quality, qct mentioned in the paper.

edit retag flag offensive close merge delete

1 answer

Sort by » oldest newest most voted
1

answered 2019-01-07 04:42:07 -0600

berak gravatar image

updated 2019-01-07 04:45:00 -0600

(1) you do this on the color channels, not on a grayscale version, like:

hb = cv2.calcHist([image[:,:,0]], [0], None, [256], [0,255])
hg = cv2.calcHist([image[:,:,1]], [0], None, [256], [0,255])
hr = cv2.calcHist([image[:,:,2]], [0], None, [256], [0,255])

(2) from here

Let the total mass of the histogram be M. Accumulate the mass in the bins, starting from index zero, until you pass 0.01 M. You get an index Q01. Decumulate the mass in the bins, starting from the maximum index, until you pass 0.99 M. You get an index Q99. These indexes are the so-called first and last percentiles. The contrast is estimated as Q99-Q01.

so, let's do that:

# normalized sum
H = hb + hg + hr
M = np.sum(H)
H /= M;

# from the left:
m0=0
for q0 in range(0, 255, 1):
   m0 += H[q0]
   if m0 >= 0.01:
      break
# from the right:
m1=1.0
for q1 in range(255, 0, -1):
   m1 -= H[q1]
   if m1 <= 0.99:
      break

qct = (q1-q0)
edit flag offensive delete link more

Comments

thanks vey much for your answer, it is really helpful for me.

bubu_ka gravatar imagebubu_ka ( 2019-01-07 20:15:47 -0600 )edit

I wan to confirm: based on your method(code), the q1: 248 , q0 is 0 for the above image. The H[0] is 0.104 bigger than 0.1. I don't know my answer is right or wrong.

bubu_ka gravatar imagebubu_ka ( 2019-01-07 20:22:37 -0600 )edit

hi @berak , I understand your answer. actually I am computing the features(3.1 gray level features) in the following paper link:https://arxiv.org/pdf/1202.2158.pdf. As the grey level contrast f1 is ok based on your answers, how about f2, I can't understand number of dominant gray level bins and mathematical form mentioned in the paper, could you give me some hints about this.

bubu_ka gravatar imagebubu_ka ( 2019-01-07 21:08:23 -0600 )edit

as the above comment, as the number of dominant b ins in the grey level histogram, what's grey level histogram, is the same as my questions like H = hb + hg + hr or just one channel after the image is converted to gray image?

bubu_ka gravatar imagebubu_ka ( 2019-01-07 21:18:06 -0600 )edit

Question Tools

1 follower

Stats

Asked: 2019-01-07 03:06:32 -0600

Seen: 1,232 times

Last updated: Jan 07 '19