Detection of leaf on unpredictable background
A project I have been working about for some time is a unsupervised leaf segmentation. The leaves are captured on a white or colored paper, and some of them has shadows.
I want to be able to threshold the leaf and also remove the shadow (while reserving the leaf's details); however I cannot use fixed threshold values due to diseases changing the color of the leaf.
Then, I begin to research and find out a proposal by Horprasert et. al. (1999) in "A Statistical Approach for Real-time Robust Background Subtraction and Shadow Detection", which compare areas in the image with colour of the now-known background using the chromacity distortion measure. This measure takes account of the fact that for desaturated colours, hue is not a relevant measure.
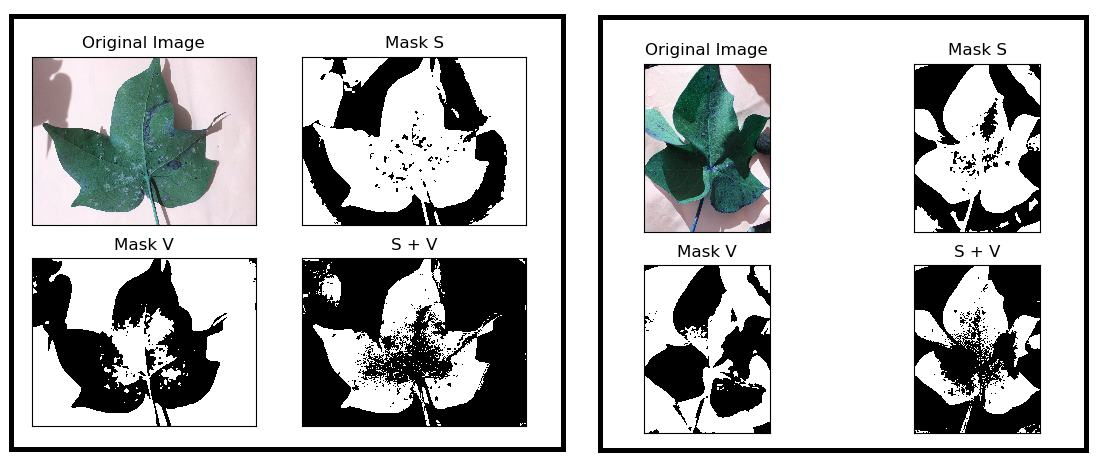
Based on it, I was able to achieve the following results:
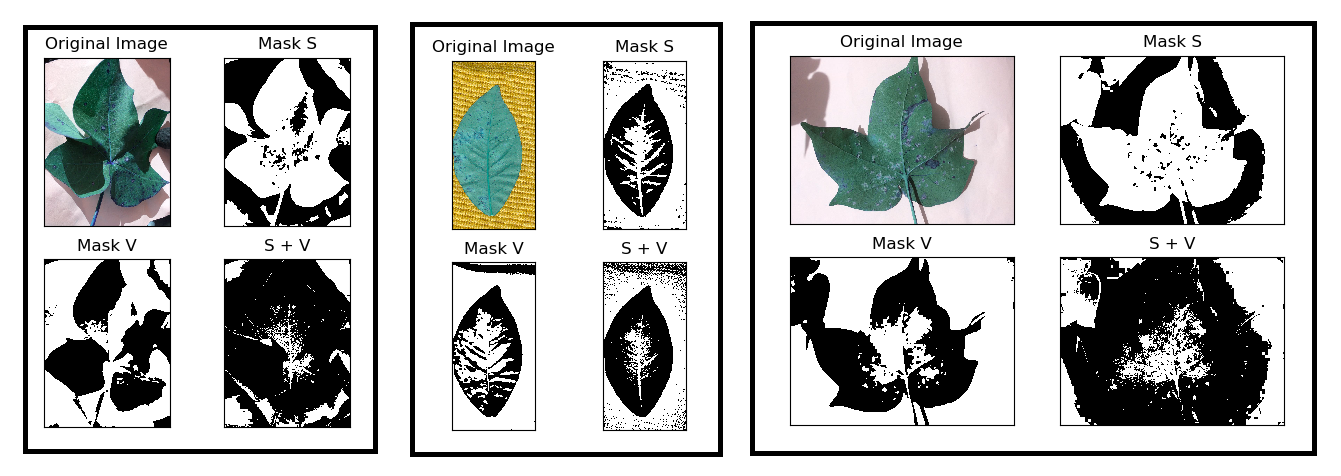
However, the leaves that are captured on a white paper need to change the Mask V cv2.bitwise_not() giving me the below result:
I'm thinking that I'm forgetting some step to get a complete mask that will work for all or most of my leaves. Samples can be found here.
My Code:
import numpy as np
import cv2
import matplotlib.pyplot as plot
import scipy.ndimage as ndimage

def brightness_distortion(I, mu, sigma):
    return np.sum(I*mu/sigma**2, axis=-1) / np.sum((mu/sigma)**2, axis=-1)


def chromacity_distortion(I, mu, sigma):
    alpha = brightness_distortion(I, mu, sigma)[...,None]
    return np.sqrt(np.sum(((I - alpha * mu)/sigma)**2, axis=-1))

def bwareafilt ( image ):
    image = image.astype(np.uint8)
    nb_components, output, stats, centroids = cv2.connectedComponentsWithStats(image, connectivity=4)
    sizes = stats[:, -1]

    max_label = 1
    max_size = sizes[1]
    for i in range(2, nb_components):
        if sizes[i] > max_size:
            max_label = i
            max_size = sizes[i]

    img2 = np.zeros(output.shape)
    img2[output == max_label] = 255

    return img2

img = cv2.imread("Amostra03.jpeg")
sat = cv2.cvtColor(img, cv2.COLOR_BGR2HSV)[:,:,1]
val = cv2.cvtColor(img, cv2.COLOR_BGR2HSV)[:,:,2]
sat = cv2.medianBlur(sat, 11)
val = cv2.medianBlur(val, 11)
thresh_S = cv2.adaptiveThreshold(sat , 255, cv2.ADAPTIVE_THRESH_MEAN_C, cv2.THRESH_BINARY, 401, 10);
thresh_V = cv2.adaptiveThreshold(val , 255, cv2.ADAPTIVE_THRESH_MEAN_C, cv2.THRESH_BINARY, 401, 10);

mean_S, stdev_S = cv2.meanStdDev(img, mask = 255 - thresh_S)
mean_S = mean_S.ravel().flatten()
stdev_S = stdev_S.ravel()
chrom_S = chromacity_distortion(img, mean_S, stdev_S)
chrom255_S = cv2.normalize(chrom_S, chrom_S, alpha=0, beta=255, norm_type=cv2.NORM_MINMAX).astype(np.uint8)[:,:,None]

mean_V, stdev_V = cv2.meanStdDev(img, mask = 255 - thresh_V)
mean_V = mean_V.ravel().flatten()
stdev_V = stdev_V.ravel()
chrom_V = chromacity_distortion(img, mean_V, stdev_V)
chrom255_V = cv2.normalize(chrom_V, chrom_V, alpha=0, beta=255, norm_type=cv2.NORM_MINMAX).astype(np.uint8)[:,:,None]

thresh2_S = cv2.adaptiveThreshold(chrom255_S , 255, cv2.ADAPTIVE_THRESH_MEAN_C, cv2.THRESH_BINARY, 401, 10);
thresh2_V = cv2.adaptiveThreshold(chrom255_V , 255, cv2.ADAPTIVE_THRESH_MEAN_C, cv2.THRESH_BINARY, 401, 10);

images = [img, thresh_S, thresh_V, cv2.bitwise_and(thresh2_S, cv2.bitwise_not(thresh2_V))]
titles = ['Original Image', 'Mask S', 'Mask V', 'S + V']
for i in range(4):
    plot.subplot(2,2,i+1),
    if i == 0 :
        plot.imshow(images[i])
    else :
        plot.imshow(images[i], cmap='gray')
    plot.title(titles[i])
    plot.xticks ...