oriented filters
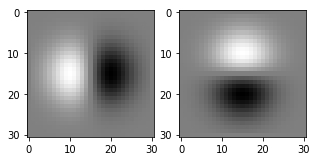
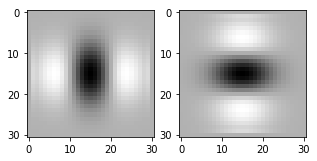
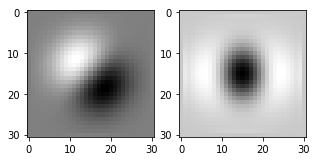
Hello, I have a simple code that creates a derivative of gaussian filter. Then I orient the filters. Problem is, I cannot get an oriented gaussian filter of derivative 2. It looks like a circular blob instead (below). I use the simple formula to create an oriented filter given an x filter and a y filter.
np.cos(np.deg2rad(45)) * dog_x2 + np.sin(np.deg2rad(45)) * dog_y2
%matplotlib inline

import numpy as np
import matplotlib.pyplot as plt
import cv2
import time
import scipy.signal as conv

plt.rcParams['figure.figsize'] = (10, 10)
plt.rcParams['image.cmap'] = 'gray'

def gaussian_filter(fSize, fSigma):
    x, y = np.mgrid[-fSize//2 + 1:fSize//2 + 1, -fSize//2 + 1:fSize//2 + 1]
    g = np.exp(-( (x**2 + y**2) / (2.0*fSigma**2) ))
    return g/g.sum()

def elongated_gaussian_filter(fSize, rad, fSigma1, fSigma2):

    a = np.cos(rad)
    b = np.sin(rad)
    c = np.cos(rad + np.pi/2)
    d = np.sin(rad + np.pi/2)

    x, y = np.mgrid[-fSize//2 + 1:fSize//2 + 1, -fSize//2 + 1:fSize//2 + 1]
    g = np.exp( -((a*x + b*y)**2 / (2.0*fSigma1**2)) - ((c*x + d*y)**2 / (2.0*fSigma2**2)) )
    return g/g.sum()

dx = np.matrix([[-1,  0,  1]])
dy = np.matrix([[-1],[0],[1]])

# dog 1
dog_x1 = cv2.filter2D(gaussian_filter(31,5), -1, dx)
dog_y1 = cv2.filter2D(gaussian_filter(31,5), -1, dy)
plt.figure(figsize=(5,5))
plt.subplot(1,2,1)
plt.imshow(dog_x1)
plt.subplot(1,2,2)
plt.imshow(dog_y1)
plt.show()

# dog 2
dog_x2 = cv2.filter2D(dog_x, -1, dx)
dog_y2 = cv2.filter2D(dog_y, -1, dy)
plt.figure(figsize=(5,5))
plt.subplot(1,2,1)
plt.imshow(dog_x2)
plt.subplot(1,2,2)
plt.imshow(dog_y2)

# oriented dog
angle = 45
oriented_dog1 = np.cos(np.deg2rad(45)) * dog_x1 + np.sin(np.deg2rad(45)) * dog_y1
oriented_dog2 = np.cos(np.deg2rad(20)) * dog_x2 + np.sin(np.deg2rad(20)) * dog_y2
plt.figure(figsize=(5,5))
plt.subplot(1,2,1)
plt.imshow(oriented_dog1)
plt.subplot(1,2,2)
plt.imshow(oriented_dog2)
plt.show()
1st order derivative of gaussian

2nd order derivative of gaussian

(left) oriented 1st order derivative of gaussian (right) oriented 2nd order derivative of gaussian

