Hi,
first Question: a standard calibration is necessary (like chessboard or circles grid) because you have to eliminate the distorion in entire image. Afterward do a line detection described below and calculate the translation matrix.
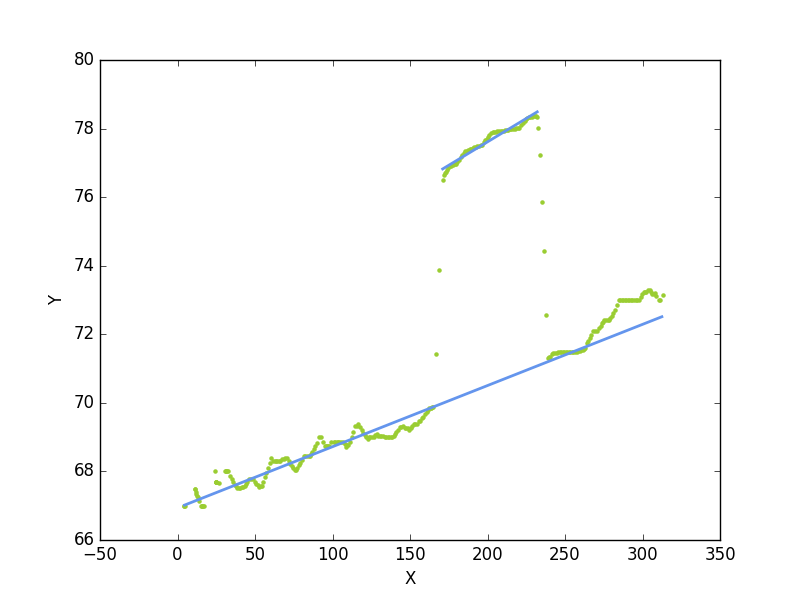
second Question: first, for each column, I would calculate points along line using e.g. center of gravity (also named center of mass). Based on these points do a line fit for the upper and lower laser line. Afterwards you can calculate the distance between the lines or for each point on the lower line the distance to the upper line, what ever you want.
Notice, that a line detection which is only done via Hough Transformation is not accurate enough for such applications.
Best
ok, I will do the job for you
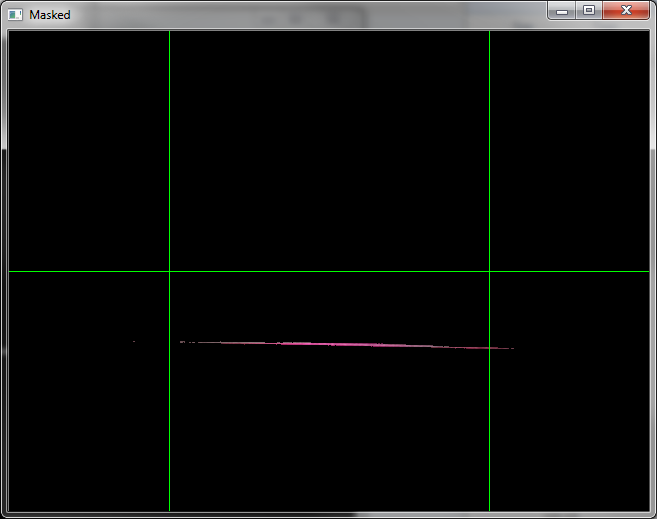
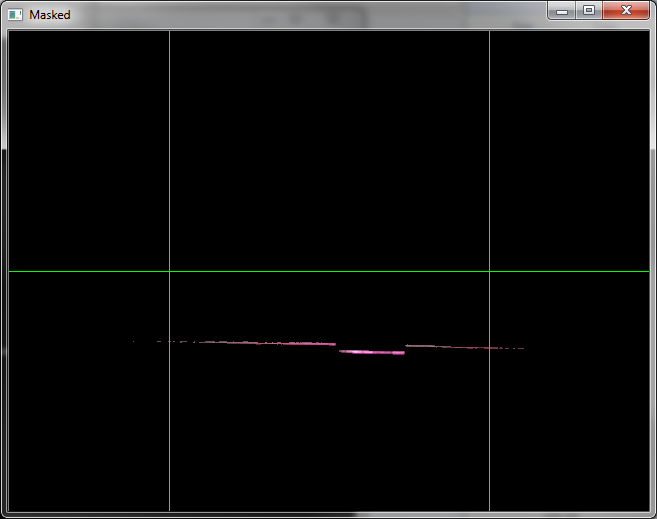
I have used the following image:

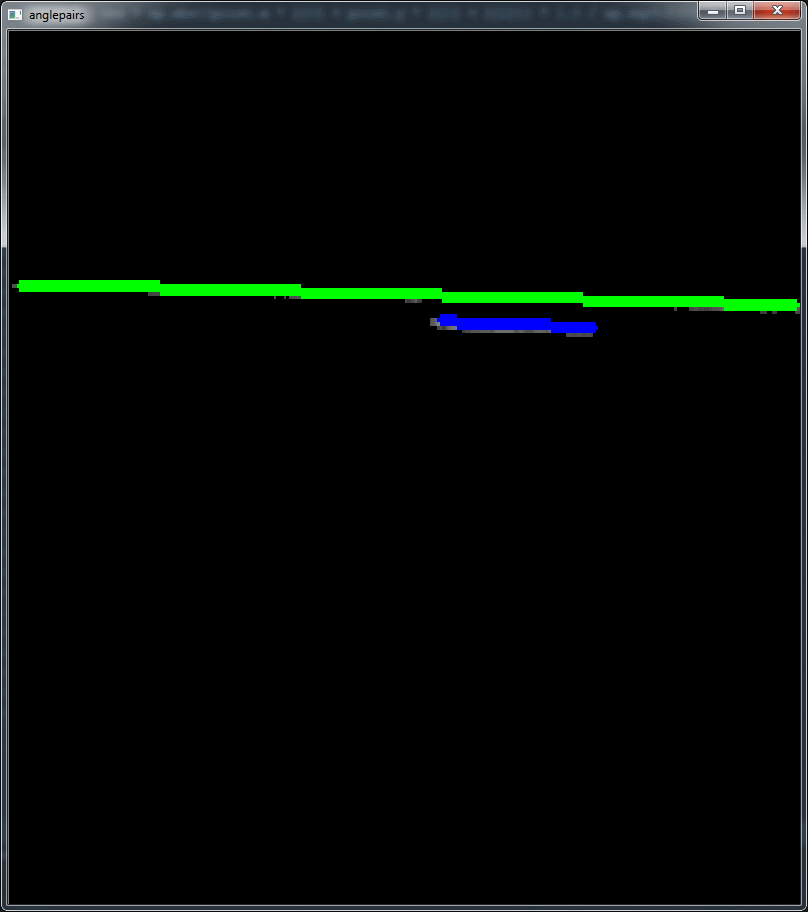
the results are:
and the code is below. However I havn't time for test, documentation, and so on...
It is only a first attempt and an important step is to separate the lower and upper points (marked in code as a todo). This must be done better and is essential for higly accurate results. But it is a working example
import cv2
import numpy as np
from sklearn import linear_model
import matplotlib.pyplot as plt

ransac = linear_model.RANSACRegressor(residual_threshold=0.5)
class point:
    def __init__(self, x, y):
        self.x = x
        self.y = y

def getCOG(im):

    h, w = im.shape
    points = []
    for colnum in range(3, w-3):
        cols = im[:, colnum-3:colnum+3]
        M = cv2.moments(cols)
        if M["m00"] != 0:
            cX = M["m10"] / M["m00"]
            cY = M["m01"] / M["m00"]
            p = point(colnum+cX, cY)
            points.append(p)

    return points

def fit_LineRansac(line):

    lineX = []
    lineY = []
    for l in line:
        lineX.append(l.x)
        lineY.append(l.y)
    lineX = np.asarray(lineX).reshape(-1, 1)
    lineY = np.asarray(lineY).reshape(-1, 1)

    #todo: split of first and second line is not trustable. must be done better
    #ransac fit for first line
    ransac.fit(lineX, lineY)
    inlier_mask = ransac.inlier_mask_
    outlier_mask = np.logical_not(inlier_mask)
    line_X1 = np.arange(lineX.min(), lineX.max())[:, np.newaxis]
    line_y_ransac1 = ransac.predict(line_X1)


    #ransac fit for second line
    lineX2 = lineX[outlier_mask]
    lineY2 = lineY[outlier_mask]
    ransac.fit(lineX2, lineY2)
    inlier_mask = ransac.inlier_mask_
    # outlier_mask = np.logical_not(inlier_mask)
    line_X2 = np.arange(np.min(lineX2[inlier_mask]), np.max(lineX2[inlier_mask]))[:, np.newaxis]
    line_y_ransac2 = ransac.predict(line_X2)


    lw = 2
    plt.xlabel("X")
    plt.ylabel("Y")
    plt.scatter(lineX, lineY, color='yellowgreen', marker='.', label='Inliers')
    plt.plot(line_X1, line_y_ransac1, color='cornflowerblue', linewidth=lw, label='RANSAC regressor')
    plt.plot(line_X2, line_y_ransac2, color='cornflowerblue', linewidth=lw, label='RANSAC regressor')
    plt.show()

    return line_X1, line_y_ransac1, line_X2, line_y_ransac2

def cross(a, b):
    res = [0,0,0]

    res[0] = a[1] * b[2] - a[2] * b[1]
    res[1] = a[2] * b[0] - a[0] * b[2]
    res[2] = a[0] * b[1] - a[1] * b[0]

    return res

def distance_to_line(linex, liney, point):
    pa = [linex[0], liney[0], 1]
    pb = [linex[-1], liney[-1], 1]

    l = cross(pa, pb)

    res = np.abs((point ...
(more)