Ask Your Question
0

Image of Graph to data: how to extract data from a curve on an image of a graph?

asked 2017-09-24 05:46:47 -0600

I am trying to write some software that at least partially automates the process of extracting data from an image of a graph. As an initial sample image I am using this graph:

image description image description

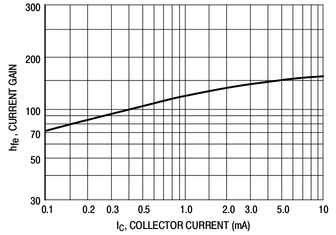
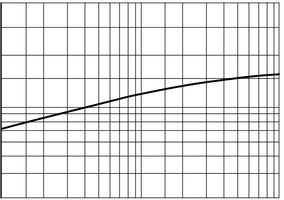
I have managed to use the threshold operation and findContours to collect all the lines in the graph as a single contour.

I now want to think about separating out the different lines. Given the graph is oriented exactly vertical it should be easy to separate out gridlines from the curve.

What I am concerned about is finding a way to make sure that the curve (and in subsequent cases each curve) is stored as one vector of Points.

Once I have written the software to do that it should be quite straightforward to do any logarithmic scaling and and text recognition (using libtesseract) to extract floating point data points for the curve.

So, are there any established ways for looking at the long term change in orientation between segments of a contour to seperate it out into individual lines and curves?

edit retag flag offensive close merge delete

Comments

sturkmen gravatar imagesturkmen ( 2017-09-24 06:52:20 -0600 )edit

Cheers, looking at it now. :-)

InterestedTom gravatar imageInterestedTom ( 2017-09-24 08:12:39 -0600 )edit

1 answer

Sort by » oldest newest most voted
0

answered 2017-09-25 06:27:15 -0600

theaniolad gravatar image

updated 2017-09-25 06:58:36 -0600

Just a quick answer. Sorry for the rough code snippets. They are untested and incomplete but might give a rough idea. So the general approach would be to find a filtering function that targets whatever distinguishes the grid lines from the graph line. Three approaches:

1. Filter by Orientation: the grid is strictly horizontal and vertical, the graph not. You can filter by orientation of the gradient (filter out orientation = 0° and 90° etc.). Rough idea (google gradient orientation for more results)

  • Step 1: roughly threshold out weak edges (e.g. cv::threshold(img, img,... 50, BINARY_THRESHOLD))
  • Step 2: take cv::angle(sx, sy) with sx and sy being the vertical and horizontal Sobel (use ksize=5 for more robust results), please check if this is the correct code, I'm not sure. You have to calculate the atan2(sx,sy) for each element.
  • Step 3: threshold out angles close to 0 and 90 etc. cv::inRange(Scalar(0)...).
  • Step 4: get the points with cv::findNonZero()

2. Filter by Thickness: as user sturkmen suggested in the comment above, morphological filtering is an easy way to filter out thinner lines. It can also be used to filter by line orientation, but this will probably not work as well as filtering through the gradient orientation.

If the thickness of the lines of the grid and the plot differs more than two pixels, it should be enough to do the following: - Step 1: strel =cv::getStructuringElement(MORPH_ELLIPSE, 3, 3) - Step2: cv::dilate(img, strel,...) //repeat this step until the grid has disappeared (can be done by setting the iterations or by manually calling the function several times). - Step 3: cv::threshold( img,...,128, BINARY_INVERSE) - Step 4: cv::findNonZero()

3. Filter by Periodicity: the grid is periodic, the graph line not. The grid could be sorted out via the peaks in the Fourier Transform. Problem: not easy to handle if you don't have experience with that, and the grid is not even really periodic in your example. So not an option here.

edit flag offensive delete link more

Question Tools

1 follower

Stats

Asked: 2017-09-24 05:46:47 -0600

Seen: 1,796 times

Last updated: Sep 25 '17