Ask Your Question
1

GLCM texture analysis using OpenCV C++

asked 2017-08-28 00:28:38 -0600

Navyadubey gravatar image

updated 2017-09-26 21:18:57 -0600

I want to convert my resultant matrix in the form of image and hence display could someone suggest me a way to display the 2D matrix in the Mat form. Here is my code

    void glcm(cv::Mat &img)
    {
     float energy=0,contrast=0,homogenity=0,IDM=0,entropy=0,mean1=0;
     int row=img.rows,col=img.cols;
     cv::Mat gl=cv::Mat::zeros(256,256,CV_32FC1);

    //creating glcm matrix with 256 levels,radius=1 and in the horizontal direction
     for(int i=0;i<row;i++)
      for(int j=0;j<col-1;j++)
         gl.at<float>(img.at<uchar>(i,j),img.at<uchar>(i,j+1))=gl.at<float>(img.at<uchar>(i,j),img.at<uchar>(i,j+1))+1;

      // normalizing glcm matrix for parameter determination
        gl=gl+gl.t();
        gl=gl/sum(gl)[0];


      for(int i=0;i<256;i++)
         for(int j=0;j<256;j++)
        {
        energy=gl.at<float>(i,j)*gl.at<float>(i,j);
        a[i][j]=energy;
//        cout<<energy;
        //finding parameters
        contrast=contrast+(i-j)*(i-j)*gl.at<float>(i,j);
        homogenity=homogenity+gl.at<float>(i,j)/(1+abs(i-j));
        if(i!=j)
          IDM=IDM+gl.at<float>(i,j)/((i-j)*(i-j));                      //Taking k=2;
        if(gl.at<float>(i,j)!=0)
          entropy=entropy-gl.at<float>(i,j)*log10(gl.at<float>(i,j));
        mean1=mean1+0.5*(i*gl.at<float>(i,j)+j*gl.at<float>(i,j));
        }

        for(int i=0;i<256;i++)
        {
          for(int j=0;j<256;j++)
           cout<<a[i][j]<<"\t";
           cout<<endl;
         }


     cout<<"energy="<<energy<<endl;
     cout<<"contrast="<<contrast<<endl;
     cout<<"homogenity="<<homogenity<<endl;
     cout<<"IDM="<<IDM<<endl;
     cout<<"entropy="<<entropy<<endl;
     cout<<"mean="<<mean1<<endl;
     }

    void MainWindow::on_pushButton_2_clicked()
    {
      void glcm(cv::Mat &);
      cv::Mat 
      img=cv::imread("C:\\Users\\trainee2017233\\Desktop\\prepost\\raster_image.png",CV_LOAD_IMAGE_UNCHANGED);            
           //input image
      if(img.empty())
     {

      }

    glcm(img);                                                                      //call to glcm function
    cv::namedWindow("Image",CV_WINDOW_AUTOSIZE);
    imshow("Image",img);
    cv::Mat d=cv::Mat(256, 256, CV_8U, &a,2); //this is just a try to convert a as mat
     cv::namedWindow("Result",CV_WINDOW_AUTOSIZE);
      cv::imshow("Result",d);

    cv::waitKey(1);
    }

I want to display this a matrix in the form of image please tell me some function or some method to do so

edit retag flag offensive close merge delete

Comments

do you REALLY need that button ? (it's more a logic problem, event based programming follows a completely different path than a console prog.)

berak gravatar imageberak ( 2017-08-28 01:02:32 -0600 )edit

@berak I don't need any kind of button I have calculated the glcm features now I just want to display the output image in which texture features are analysed.

Navyadubey gravatar imageNavyadubey ( 2017-08-28 04:28:07 -0600 )edit

then just do your imshow(), where the image is

berak gravatar imageberak ( 2017-08-28 04:31:30 -0600 )edit

@berak as you can see in the piece of code provided that I am unable to form an image with these features , so could you plz suggest how to display features in an image

Navyadubey gravatar imageNavyadubey ( 2017-08-28 04:33:34 -0600 )edit
1

First, when computing the glcm matrix, reduce the number of shades (colors) to 16 or 32.

Then, calculate the haralick features on a small (sliding) window of your image.

Create new images for every feature and set the value of every pixel to the resulting value of the analysis of the corresponding window.

kbarni gravatar imagekbarni ( 2017-08-28 13:30:26 -0600 )edit

@kbarni thanks for the reply, could you please provide some reference or some piece of code for the same as I am new to OpenCV and image processing so I am finding this difficult to understand and implement.

Navyadubey gravatar imageNavyadubey ( 2017-08-29 05:21:32 -0600 )edit

btw, the energy is the sum of the squared glcm values, and your "a" matrix does not make any sense.

https://dsp.stackexchange.com/questio...

berak gravatar imageberak ( 2017-08-31 02:58:19 -0600 )edit

yes you are right energy is a number i.e sum of squared glcm values but as it happens in software like ENVI in which when we have to do texture analysis than what we input is an image and we get the output as an image it can be energy image contrast image etc, hence I feel that if an image is being displayed then there must be some matrix present and the corresponding pixel by pixel value of energy is calculated and hence displayed as an image in output. This is what I want to do @berak

Navyadubey gravatar imageNavyadubey ( 2017-08-31 04:49:23 -0600 )edit

yes, so follow kbarni's idea and the link above. subsample a glcm feature, like energy, from a 5x5 window of your image, then take the energy as the pixel value for the top-left corner of that patch. move your patch by 1 pixel, and repeat. in the end, you'll have an image with the glcm energy features from your original img.

berak gravatar imageberak ( 2017-08-31 04:55:19 -0600 )edit

@berak I was trying to follow what kbarni said but I am finding it very difficult to divide it into a window and all could you please provide some reference. And one more thing the concept of window is what we implement in advanced versions but I don't want to do that, for now, I just want that value of energy must be calculated corresponding to every pixel and hence a new energy matrix must be formed then, for now, I just want to display that matrix in the form of an image.

Navyadubey gravatar imageNavyadubey ( 2017-08-31 05:03:08 -0600 )edit

2 answers

Sort by » oldest newest most voted
1

answered 2017-08-31 08:23:31 -0600

kbarni gravatar image

Ok, here is the code I would use. It takes 16x16 pixel subimages and calculates the Haralick features for each subimage. Then, it displays the repartition of a given feature on the dest image.

Mat im=imread("lena.jpg",CV_LOAD_IMAGE_GRAYSCALE); //!!!! GLCM works ONLY on grayscale images
Mat dest(im.rows,im.cols,CV_64F);
for(int y=8;y<im.rows-8;y++)
    for(int x=8;x<im.cols-8;x++){
        Mat subimg=Mat(img,Rect(x-8,y-8,16,16));  //take a 16x16 subimage
        double feature=GLCM(subimg);  //get the energy (or other feature) for this window
        dest.at<double>(y,x)=feaure;
    }

You have to change the GLCM fuction:

double GLCM(Mat &image)
{
    ....
    return energy; //or any other feature
 }

I didn't check all the GLCM code, but as I said, there is a bug in the energy calculation:

double asm=0;  //angular second moment
...
for (int i = 0; i<256; i++)
    for (int j = 0; j<256; j++)
    {
        asm = asm + gl.at<float>(i, j)*gl.at<float>(i, j); //!!!!!
        ...
    }
energy=sqrt(asm); //!!!!!

As I said earlier, it's also a good idea to reduce the number of gray levels to 16 for much faster calculation.

Also note that the gl matrix is integer type, not float.

edit flag offensive delete link more

Comments

This code is just to calculate the features but as I said that it doesn't display any feature as an image

Navyadubey gravatar imageNavyadubey ( 2017-09-01 00:26:04 -0600 )edit

And one more thing, Are you suggesting me to change the type of gl matrix as an integer?

Navyadubey gravatar imageNavyadubey ( 2017-09-01 01:04:07 -0600 )edit

Yes, the gl is an integer (or uchar) matrix. It can only contain integer values, as it counts something.

If you want to display the image, add imshow(dest); to the end of the code. Maybe you'll have to normalize the image between (0,1).

kbarni gravatar imagekbarni ( 2017-09-02 14:03:12 -0600 )edit
0

answered 2017-08-31 03:31:09 -0600

updated 2017-08-31 04:59:18 -0600

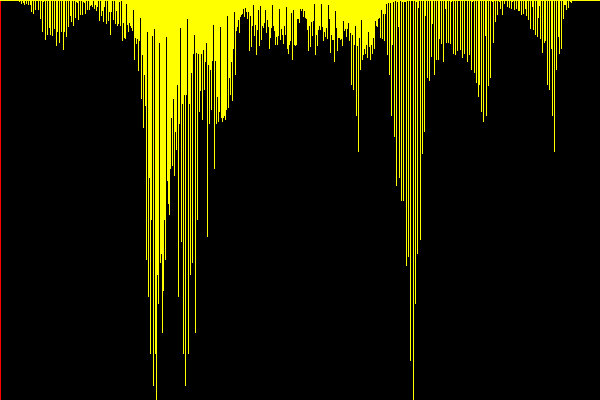
if you have compiled OpenCV with contrib modules you can use cv::plot::Plot2d

i made some modification on your code and get the following graph for lena.jpg

image description

#include <opencv2/core.hpp>
#include <opencv2/highgui.hpp>
#include <opencv2/imgproc.hpp>
#include <opencv2/plot.hpp>
#include <iostream>

using namespace cv;
using namespace std;


void glcm(const Mat img, vector<double> &vec_energy)
{
    float energy = 0, contrast = 0, homogenity = 0, IDM = 0, entropy = 0, mean1 = 0;
    int row = img.rows, col = img.cols;
    cv::Mat gl = cv::Mat::zeros(256, 256, CV_32FC1);

    //creating glcm matrix with 256 levels,radius=1 and in the horizontal direction
    for (int i = 0; i<row; i++)
        for (int j = 0; j<col - 1; j++)
            gl.at<float>(img.at<uchar>(i, j), img.at<uchar>(i, j + 1)) = gl.at<float>(img.at<uchar>(i, j), img.at<uchar>(i, j + 1)) + 1;

    // normalizing glcm matrix for parameter determination
    gl = gl + gl.t();
    gl = gl / sum(gl)[0];


    for (int i = 0; i<256; i++)
        for (int j = 0; j<256; j++)
        {
            energy = gl.at<float>(i, j)*gl.at<float>(i, j);
            vec_energy.push_back(energy);

            //finding parameters
            contrast = contrast + (i - j)*(i - j)*gl.at<float>(i, j);
            homogenity = homogenity + gl.at<float>(i, j) / (1 + abs(i - j));
            if (i != j)
                IDM = IDM + gl.at<float>(i, j) / ((i - j)*(i - j));                      //Taking k=2;
            if (gl.at<float>(i, j) != 0)
                entropy = entropy - gl.at<float>(i, j)*log10(gl.at<float>(i, j));
            mean1 = mean1 + 0.5*(i*gl.at<float>(i, j) + j*gl.at<float>(i, j));
        }

/*  for (int i = 0; i<256; i++)
    {
        for (int j = 0; j<256; j++)
            cout << a[i][j] << "\t";
        cout << endl;
    }*/


    cout << "energy=" << energy << endl;
    cout << "contrast=" << contrast << endl;
    cout << "homogenity=" << homogenity << endl;
    cout << "IDM=" << IDM << endl;
    cout << "entropy=" << entropy << endl;
    cout << "mean=" << mean1 << endl;
}


int main(int argc, char** argv)
{


    Mat img = cv::imread(argv[1], CV_LOAD_IMAGE_UNCHANGED);

    if (img.empty())
    {
        cout << "can not load " << argv[1];
        return 1;
    }
    imshow("Image", img);

    vector<double> vec_energy;
    glcm(img, vec_energy);   //call to glcm function

    Mat mat_energy = Mat(vec_energy);

    Mat plot_result;

    Ptr<plot::Plot2d> plot = plot::Plot2d::create(mat_energy);
    plot->setShowGrid(false);
    plot->setShowText(false);
    plot->render(plot_result);

    imshow("plot", plot_result);
    cv::waitKey(0);
    return 0;
}

if you don't have plot module installed you can use

#include <opencv2/core.hpp>
#include <opencv2/highgui.hpp>
#include <opencv2/imgproc.hpp>

#include <iostream>

using namespace cv;
using namespace std;

namespace cv
{
    namespace plot
    {
        //! @addtogroup plot
        //! @{

        class CV_EXPORTS_W Plot2d : public Algorithm
        {
        public:

            CV_WRAP virtual void setMinX(double _plotMinX) = 0;
            CV_WRAP virtual void setMinY(double _plotMinY) = 0;
            CV_WRAP virtual void setMaxX(double _plotMaxX) = 0;
            CV_WRAP virtual void setMaxY(double _plotMaxY) = 0;
            CV_WRAP virtual void setPlotLineWidth(int _plotLineWidth) = 0;
            /**
            * @brief Switches data visualization mode
            *
            * @Param _needPlotLine if true then neighbour plot points will be connected by lines.
            * In other case data will be plotted as a set of standalone points.
            */
            CV_WRAP virtual void setNeedPlotLine(bool _needPlotLine) = 0;
            CV_WRAP virtual void setPlotLineColor(Scalar _plotLineColor) = 0;
            CV_WRAP virtual ...
(more)
edit flag offensive delete link more

Comments

thank you so much for the reply @sturkmen but there was no plot.hpp present in my openCV so I created a file with the name plot.hpp and now it is able to find the .hpp file but it shows some error in the line
Ptr<plot::plot2d> plot = plot::Plot2d::create(mat_energy); the error is:- error: undefined reference to `cv::plot::Plot2d::create(cv::_InputArray const&)'

please help.

Navyadubey gravatar imageNavyadubey ( 2017-08-31 04:45:26 -0600 )edit

answer updated

sturkmen gravatar imagesturkmen ( 2017-08-31 04:59:58 -0600 )edit

one more question This displays a bar graph of energy but I want to see the energy image in the same way it is visualised in software like ENVI.... It will be helpful if you could help

Navyadubey gravatar imageNavyadubey ( 2017-08-31 05:11:49 -0600 )edit

Attention, the answer is incorrect!

First, using the GLCM matrix, energy=sqrt(sum(GL[i,i]²)), not GL[i,i]²!

The OP probably doesn't want to display the different squared values of the GLCM matrix, but the value of the Haralick features for different parts of the image.

kbarni gravatar imagekbarni ( 2017-08-31 08:00:37 -0600 )edit

he he, the answer is only for visualization. i don't have any idea about the data:) @kbarni you can edit the answer

sturkmen gravatar imagesturkmen ( 2017-08-31 08:04:21 -0600 )edit

@kbarni I want to display the image not the graph and if you talk about the formula that I can correct... Sir, could you please tell me the code how to display the gray scale image of energy or contrast or any GLCM feature.

Navyadubey gravatar imageNavyadubey ( 2017-09-01 00:21:43 -0600 )edit

@sturkmen I want to display an image, not a graph.

Navyadubey gravatar imageNavyadubey ( 2017-09-01 00:54:04 -0600 )edit

Question Tools

1 follower

Stats

Asked: 2017-08-28 00:24:44 -0600

Seen: 5,827 times

Last updated: Aug 31 '17