Voice recognition with spectrogram
 Can we find out total number of speakers and their duration by looking at/analysing spectrogram.!
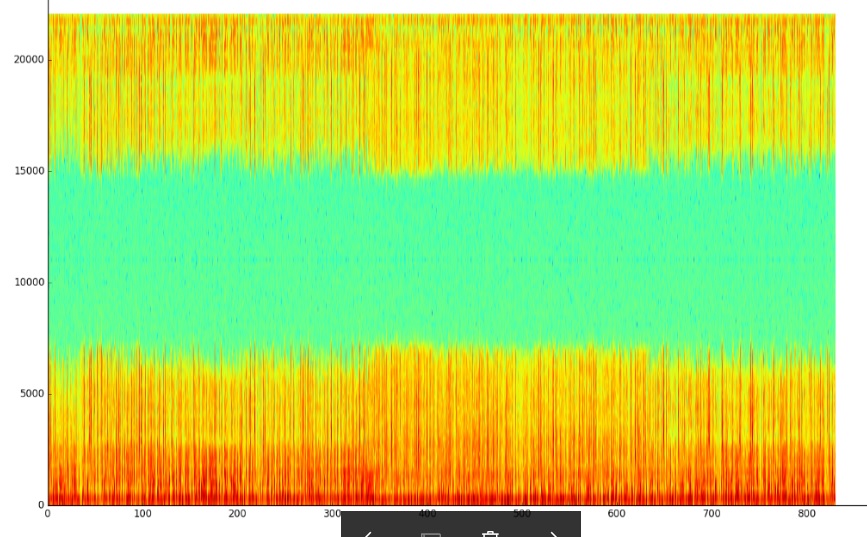
[image description]
(https://drive.google.com/drive/folder...)
Can we find out total number of speakers and their duration by looking at/analysing spectrogram.!
[image description]
(https://drive.google.com/drive/folder...)
By just looking at the image, I can see some pattern, but I am looking for right solution in terms of opencv code(python)
I think you're pretty lost here... in any case, the image is not accessible
@LorenaGdL may be lost but may be not
@LBerger processing audio is definitely working in the frequency domain. But that doesn't mean that just looking at the spectum image (speaking of pure computer vision) you can retrieve audio and perform voice recognition, that's a whole different story. Doable? Maybe. Doable by the OP? I don't think so to be honest...
Yeah, all the analysis in @LBerger's link is being done on the actual data. The spectrogram is just to display it. Maybe you could adapt something from the illumination/reflectance separation work, but it would take a lot of alteration.
i share the image now. You are right that illumination/reflectance separation seems to work. What kind of altercations should we do ?
@NavinM this is going nowhere, mainly because you show no effort at all. Have you researched about the topic? Do you have any idea to actually tackle the problem? If not, we're not here to do the work for you. Once you specific OpenCV problems, come back
I am working on code to measure the separation but it is not something very good. I also want to consider the peak points( in region of illuminance) for identification of speech. Is there subtle way of doing it ?
@Tetragramm Sorry I think my link is not good for this problem because here it seems there is only one sensor .
@NavinM " just looking at the image, I can see some pattern" I think it is likeRorschach figure. I'm agree with @LorenaGdL come back with a method and a source file and it will be easyer to help you
you would'not do computer-vision, based on an acoustical description of an image, - or would you ?
(imho, you're simply on the wrong rail here. go and process audio data, not images.)
as my purpose is to identify speakers, not what they say.. Audio data has two aspect: Identification of speakers(speaker1 for first 2 min, then speaker2 for next 1 min, then speaker 1 for next 1 min... sort of) can be done in frequency domain only that is captured in spectrogram. And secod aspect: what they say( I am not interested in it at present) . That is why spectrogram analysis seems to be crucial for my work ..