How to use the functions of convertTo, applyColorMap,imshow to get the result I want?
Here is the code in Matlab and the result picture I get using Matlab. For some purposes, I need to convert Matlab code into C++. I have done the conversion of data structure in c++, and then I need to deal with the part of showing picture. I decide to use Opencv library to replace the image procesing in Matlab. I have found that some functions like convertTo, applyColorMap and imshow in Opencv can replace the function imagesc in Matlab. So, I imitate the code online I searched. But it doesn't work.Maybe there are some grammer mistakes in my questions, sorry about that. Here is my code in C++
for (cutNumber = 1; cutNumber <= 9; cutNumber++)
{
    momentString = "dBT";
    DataSelect* BaseData_Select = select(theObj,cutNumber,momentString);
    int ncols = BaseData_Select->allLength / BaseData_Select->dataLength;
   //对应matlab auto.m第138行。下面是绘制dBZ的B显图
    Mat mydata(BaseData_Select->dataLength, ncols, CV_32F);
    for (int i = 0; i < BaseData_Select->dataLength; i++)
     {
        for (int j = 0; j < ncols; j++)
        {
            int temmmp = i*ncols+ j;
            mydata.at<float>(i, j) = BaseData_Select->data[i*ncols + j];
        }
     }
    double Amin = *min_element(mydata.begin<float>(), mydata.end<float>());  //Amin is -19
    double Amax = *max_element(mydata.begin<float>(), mydata.end<float>());  //Amax is 64
    cv::minMaxIdx(mydata, &Amin, &Amax);
    cv::Mat adjMap;
    float scale = 255 / (Amax - Amin);
    mydata.convertTo(adjMap, CV_8UC1, scale, -Amin*scale);
    cv::Mat resultMap;
    applyColorMap(adjMap, resultMap, cv::COLORMAP_AUTUMN);
    cv::imshow("Out", resultMap);
    cv::imwrite("output.bmp", resultMap);
}
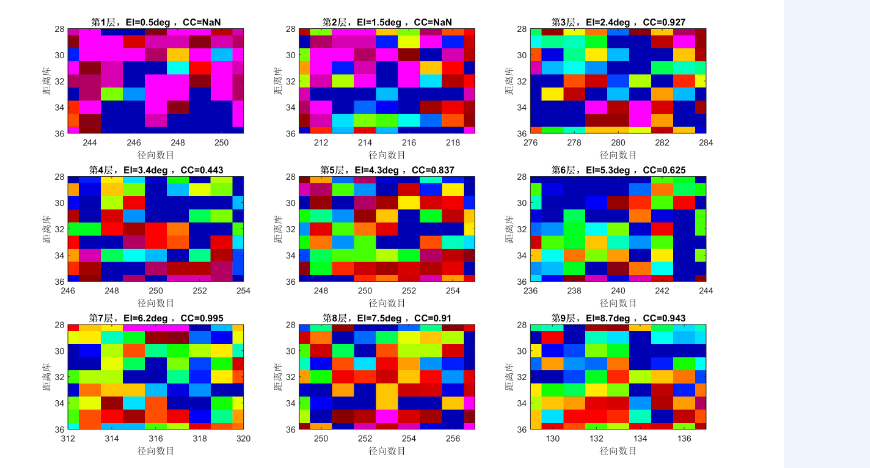
Here is the code dealing with images in Matlab.
 figure(H_figure_ZDR);
            subplot(3,3,Cut_Number);
            imagesc(ZDR.Data);
            colormap(radarcolor_CJJ(40,1));   %产生40种颜色
            caxis([ -2 6]);
            ylim([Sphere_Distance_Cell-Sphere_Distance_Cell_Extend Sphere_Distance_Cell+Sphere_Distance_Cell_Extend])
            xlim([Sphere_Center_Ray-Sphere_Azimuth_Cell_Extend Sphere_Center_Ray+Sphere_Azimuth_Cell_Extend])
            xlabel('径向数目');
            ylabel('距离库');
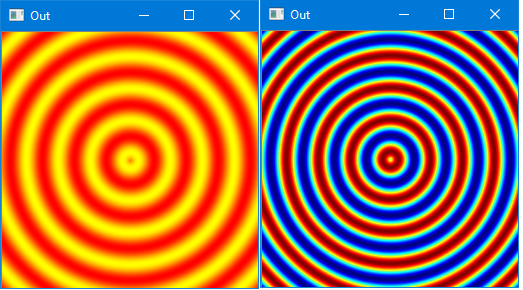
The result picture running on Matlab which is I want to get using Opencv functions.
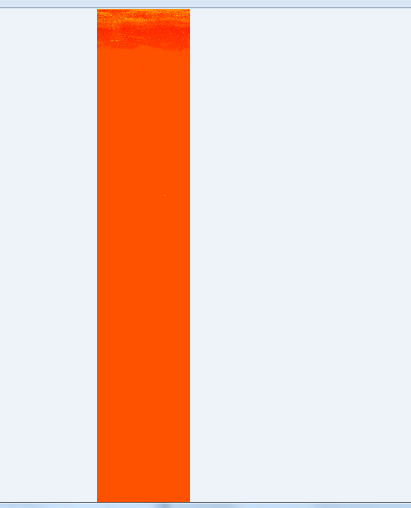
And my result picture in C++ is the following picture which is the wrong picture absolutely. I am a new learner for opencv, but time is limited. Could any one help me to solve this problem?