I would suggest to do better preprocessing because of non uniform background and to avoid blur because thin arcs can disappear.
When you have a good mask for your drawing you can use massive morphology operation to isolate nodes and arcs
Finally you have to design a logic to build the chart connections.
edit: small changes in descriptions
Below is my DiagramAnalyzer to convert your image into a Graphviz/dot chart. Here is the result
graph G{
    N0 N1 N2 N3 N4
    N1 -- N0
    N2 -- N0
    N3 -- N2
    N3 -- N1
    N4 -- N3
}
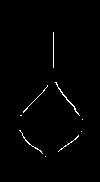
Enumerating: 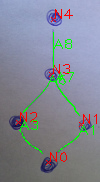 Layout by Graphviz/dot
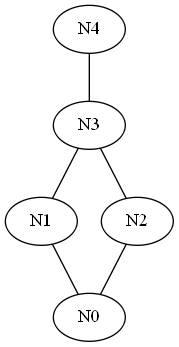
int DiagramAnalyzer()
{
    Mat src, bw;
    src = imread("../img/diagram-x5.jpg");
==PREPROCESSING==
Option1: Remove non uniform background/illumination. You can achieve this using the wonderful quadratic background removal by @LBerger. Than get a mask of the drawing using a simple threshold
#if 1
    Mat srcGray, dstGray;
    cvtColor(src, srcGray, CV_BGR2GRAY);
    BackgroundRemoveQuadratic(srcGray, dstGray);
    threshold(dstGray, bw, 100, 255, THRESH_OTSU);
Quadratic result 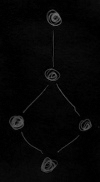 threshold
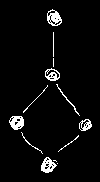
OR Option2: Get the HSV planes and threshold high values in S (>=95 percentile) to get a mask of the drawing. You can achieve this using clipHistPercent=5 with BrightnessAndContrastAuto than get a binary mask looking at very high values in saturation
#else
    Mat src_hsv, saturation;
    vector<cv::Mat> hsv_planes;
    cvtColor(src, src_hsv, CV_BGR2HSV);
    cv::split(src_hsv, hsv_planes);
    saturation = hsv_planes[1];
    BrightnessAndContrastAuto(saturation, saturation, 5);
    bw = saturation >= 254;
#endif
Saturation result (look at values of drawing) 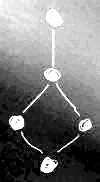 threshold
fill circular structures using small circle
int nodeSize = 15; //avg node diameter in px
Morph(bw, bw, MORPH_CLOSE, MORPH_ELLIPSE, cvRound(nodeSize / 5));
imshow("Preprocessing", bw);
 Preprocessing (result of quadratic)
GET MASK OF NODES: remove boundary structures smaller than nodeSize . Should remove the arcs
cv::Mat nodesMask;
Morph(bw, nodesMask, MORPH_OPEN, MORPH_ELLIPSE, cvRound(nodeSize / 5));
imshow("Nodes-Mask", nodesMask);
 Node Mask
GET MASK OF ARCS: dilate nodes a bit (ensure node vs arcs separation) than subtract them from the global mask
cv::Mat arcs, nodesLarger;
Morph(nodesMask, nodesLarger, MORPH_DILATE, MORPH_ELLIPSE, 1);
arcs = bw - nodesLarger;
imshow("Arcs-Mask", arcs);
 Arcs Mask
GET INTERSECTIONS: ensure node vs arcs intersection doubling size of nodes than get a mask of shared pixels
cv::Mat intersections;
Morph(nodesLarger, nodesLarger, MORPH_DILATE, MORPH_ELLIPSE, nodeSize);
intersections = nodesLarger & arcs;
GET CONTOURS OF ELEMENTS
vector<vector<Point> > nodesContours, arcsContours, intesectsContours;
findContours(nodesLarger, nodesContours, CV_RETR_EXTERNAL, CHAIN_APPROX_SIMPLE);
findContours(arcs, arcsContours, CV_RETR_EXTERNAL, CHAIN_APPROX_SIMPLE);
findContours(intersections, intesectsContours, CV_RETR_EXTERNAL, CHAIN_APPROX_SIMPLE);
vector<Point> nodesCenter(nodesContours.size(), Point(-1, -1));
vector<double> nodesArea(nodesContours.size(), -1);
vector<double> arcsLenght(arcsContours.size(), -1);
DRAW ENUMERATED CONTOURS and get center of nodes
Moments m;
Point center;
Scalar cl = Scalar(0, 0, 255);
double val,minvalue = nodeSize/3;
for (size_t i = 0; i < nodesContours.size(); i++)
{
    val = contourArea(nodesContours[i]);
    if (val < minvalue) continue; //skip if it's small
    nodesArea[i] = val;
    m = moments(nodesContours[i], true);
    //if (m.m00 == 0) continue;
    center = Point(m.m10 / m.m00, m.m01 / m.m00);
    nodesCenter[i] = center;
    drawMarker(src, center, cl, MARKER_TILTED_CROSS, 5);
    putText(src, "N" + to_string(i), center, FONT_HERSHEY_PLAIN, 1, cl);
}
cl = Scalar(0, 255, 0);
minvalue = nodeSize/5 ...
(more)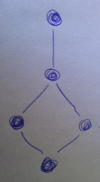


Ow wait, some pointers
adaptive gaussian thresholdplease forget this. Go for a simple binary OTSU thresholding. There is a clear difference between the color of the background and the color of the writings so it should go fairly easy.You can't use OTSU threshold here. OTSU minimizes the intra-class variance... in binary thresholding it uses just 2 classes. Here background histogram is so spread due to non uniform illumination and the tenuous foreground signal is lost within 2 main classes. More simply, take a look at grayscale histogram... there aren't 2 peaks (class) for fg and bk that's why OTSU can't works
this is coming in my mind ;-)