This forum is disabled, please visit https://forum.opencv.org
| | 1 | initial version |
@theodore, could you take a look at my try at your code
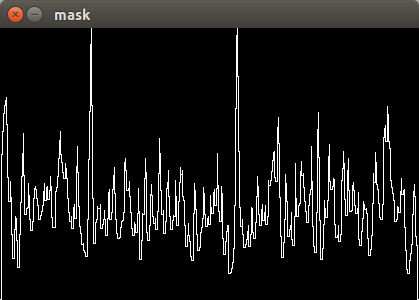
I got the mask of the histogram
But when I calculate and visualize the peaks, I get this result
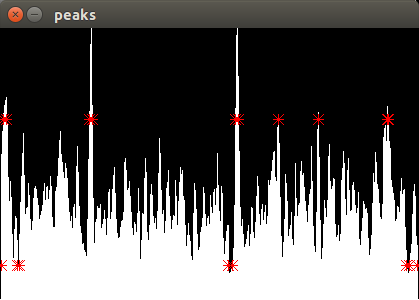
Any idea why I would get this odd locations as peaks?
| | 2 | No.2 Revision |
@theodore, could you take a look at my try at your code
I got the mask of the histogram
But when I calculate and visualize the peaks, I get this result
Any idea why I would get this odd locations as peaks?
Code I am using for it
Mat mask;
hist_copy.convertTo(hist_copy, CV_32FC1);

double min_val, max_val;
minMaxLoc(hist_copy, &min_val, &max_val);

non_maxima_suppression(hist_copy, mask, true); // extract local maxima

vector<Point> maxima;   // output, locations of non-zero pixels
cv::findNonZero(mask, maxima);

for(vector<Point>::iterator it = maxima.begin(); it != maxima.end();)
{
    Point pnt = *it;
    float pVal = hist_copy.at<float>(pnt.y - 1);
    float val = hist_copy.at<float>(pnt.y);
    float nVal = hist_copy.at<float>(pnt.y+1);
    // filter peaks
    if((val > max_val*0.2))
        ++it;
    else
        it = maxima.erase(it);
}

// Make a color hist
Mat hist_color(hist_copy.rows, hist_copy.cols, CV_32FC3);
Mat in_h[] = { hist_copy.clone(), hist_copy.clone(), hist_copy.clone() };
int from_to_h[] = { 0,0, 1,1, 2,2 };
mixChannels( in_h, 3, &hist_color, 1, from_to_h, 3 );
for(int i=0; i < maxima.size(); i++){
    drawMarker(hist_color, maxima[i], Scalar(0,0,255), MARKER_STAR, 10, 1);
}

imshow("peaks", hist_color); waitKey(0);
