This forum is disabled, please visit https://forum.opencv.org
| | 1 | initial version |
Small example following my previous comment. Obviously it is C++, but porting to Java should be straightforward. Once again, you already had the drawing part in your code, what it's missing is the curve definition (and that, of course, is a pure mathematical thing and has nothing to do with OpenCV).
Mat img(350, 300, CV_8UC1, Scalar(0));
Mat img2 = img.clone();
float start_point_x = 20;
float end_point_x = 120;
vector<Point2f> curvePoints;
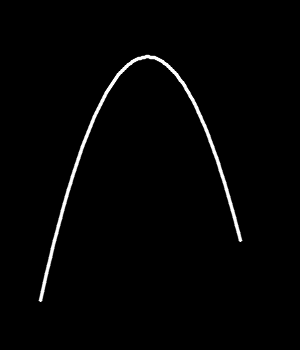
//Define the curve through equation. In this example, a simple parabola
for (float x = start_point_x; x <= end_point_x; x+=1){
float y = 0.0425*x*x - 6.25*x + 258;
Point2f new_point = Point2f(2*x, 2*y); //resized to better visualize
curvePoints.push_back(new_point); //add point to vector/list
}
//Option 1: use polylines
Mat curve(curvePoints, true);
curve.convertTo(curve, CV_32S); //adapt type for polylines
polylines(img, curve, false, Scalar(255), 2, CV_AA);
//Option 2: use line with each pair of consecutives points
for (int i = 0; i < curvePoints.size() - 1; i++){
line(img2, curvePoints[i], curvePoints[i + 1], Scalar(255), 2, CV_AA);
}
imshow("Curve 1 - polylines", img);
imshow("Curve 2 - line", img2);
waitKey();
And that results in the following images (img on the left, img2 on the right - yep, they're identical)
![image description] (/upfiles/14467453272361183.png)
| | 2 | No.2 Revision |
Small example following my previous comment. Obviously it is C++, but porting to Java should be straightforward. Once again, you already had the drawing part in your code, what it's missing is the curve definition (and that, of course, is a pure mathematical thing and has nothing to do with OpenCV).
Mat img(350, 300, CV_8UC1, Scalar(0));
Mat img2 = img.clone();

float start_point_x = 20;
float end_point_x = 120;
vector<Point2f> curvePoints;

//Define the curve through equation. In this example, a simple parabola
for (float x = start_point_x; x <= end_point_x; x+=1){
    float y = 0.0425*x*x - 6.25*x + 258;
    Point2f new_point = Point2f(2*x, 2*y);                  //resized to better visualize
    curvePoints.push_back(new_point);                       //add point to vector/list
}

//Option 1: use polylines
Mat curve(curvePoints, true);
curve.convertTo(curve, CV_32S); //adapt type for polylines
polylines(img, curve, false, Scalar(255), 2, CV_AA);

//Option 2: use line with each pair of consecutives points
for (int i = 0; i < curvePoints.size() - 1; i++){
    line(img2, curvePoints[i], curvePoints[i + 1], Scalar(255), 2, CV_AA);

}

imshow("Curve 1 - polylines", img);
imshow("Curve 2 - line", img2);
waitKey();
And that results in the following images (img on the left, img2 on the right - yep, they're identical)
![image description] (/upfiles/14467453272361183.png)