This forum is disabled, please visit https://forum.opencv.org
| | 1 | initial version |
try this code:
#include <iostream>
#include <opencv2/opencv.hpp>

using namespace std;
using namespace cv;

Mat drawHistogram(Mat &hist, int hist_h = 400, int hist_w = 1012, int hist_size = 256, Scalar color = Scalar(255, 255, 255), int type = 2, string title = "Histogram")
{
    int bin_w = cvRound( (double) hist_w/hist_size );

    Mat histImage( hist_h, hist_w, CV_8UC3, Scalar( 0,0,0) );

    /// Normalize the result to [ 0, histImage.rows ]
    normalize(hist, hist, 0, histImage.rows, NORM_MINMAX, -1, Mat() );

    switch (type) {
    case 1:
        for(int i = 0; i < histImage.cols; i++)
        {
            const unsigned x = i;
            const unsigned y = hist_h;

            line(histImage, Point(bin_w * x, y),
                 Point(bin_w * x, y - cvRound(hist.at<float>(i))),
                 color);
        }

        break;
    case 2:
        for( int i = 0; i < hist_size; ++i)
        {
            Point pt1 = Point(bin_w * (i-1), hist_h);
            Point pt2 = Point(bin_w * i, hist_h);
            Point pt3 = Point(bin_w * i, hist_h - cvRound(hist.at<float>(i)));
            Point pt4 = Point(bin_w * (i-1), hist_h - cvRound(hist.at<float>(i-1)));
            Point pts[] = {pt1, pt2, pt3, pt4, pt1};

            fillConvexPoly(histImage, pts, 5, color);
        }
        break;
    default:
        for( int i = 0; i < hist_size; ++i)
        {
            line( histImage, Point( bin_w * (i-1), hist_h - cvRound(hist.at<float>(i-1))) ,
                             Point( bin_w * (i), hist_h - cvRound(hist.at<float>(i))),
                             color, 1, 8, 0);
        }

        break;
    }

    imshow(title, histImage);

    return histImage;
}
int main()
{
        /// Load image
        Mat src = imread( "lena.png");
        if( !src.data )
          { return -1; }

        Mat gray;
        cvtColor(src, gray, CV_RGB2GRAY);

        /// Establish the number of bins
        int histSize = 256;

        /// Set the range
        float range[] = { 0, 256 } ;
        const float* histRange = { range };

        bool uniform = true; bool accumulate = false;

        // compute the histogram
        Mat hist;
        calcHist( &gray, 1, 0, Mat(), hist, 1, &histSize, &histRange, uniform, accumulate );

        // calculate cumulative histogram
        Mat c_hist(hist.size(), hist.type());

        for(size_t k = 0; k < hist.rows; ++k)
            c_hist.at<float>(k) = hist.at<float>(k) + c_hist.at<float>(k-1);

        // draw histogram
        drawHistogram(hist, 400, 1024, hist.rows, Scalar(255, 255, 255), 2);
        // draw cumulative histogram
        drawHistogram(c_hist, 400, 1024, c_hist.rows, Scalar(255, 255, 255), 2, "cumulativeHistogram");

        waitKey(0);

        return 0;
}
| | 2 | No.2 Revision |
try this code:
#include <iostream>
#include <opencv2/opencv.hpp>

using namespace std;
using namespace cv;

Mat drawHistogram(Mat &hist, int hist_h = 400, int hist_w = 1012, int hist_size = 256, Scalar color = Scalar(255, 255, 255), int type = 2, string title = "Histogram")
{
    int bin_w = cvRound( (double) hist_w/hist_size );

    Mat histImage( hist_h, hist_w, CV_8UC3, Scalar( 0,0,0) );

    /// Normalize the result to [ 0, histImage.rows ]
    normalize(hist, hist, 0, histImage.rows, NORM_MINMAX, -1, Mat() );

    switch (type) {
    case 1:
        for(int i = 0; i < histImage.cols; i++)
        {
            const unsigned x = i;
            const unsigned y = hist_h;

            line(histImage, Point(bin_w * x, y),
                 Point(bin_w * x, y - cvRound(hist.at<float>(i))),
                 color);
        }

        break;
    case 2:
        for( int i = 0; 1; i < hist_size; ++i)
        {
            Point pt1 = Point(bin_w * (i-1), hist_h);
            Point pt2 = Point(bin_w * i, hist_h);
            Point pt3 = Point(bin_w * i, hist_h - cvRound(hist.at<float>(i)));
            Point pt4 = Point(bin_w * (i-1), hist_h - cvRound(hist.at<float>(i-1)));
            Point pts[] = {pt1, pt2, pt3, pt4, pt1};

            fillConvexPoly(histImage, pts, 5, color);
        }
        break;
    default:
        for( int i = 0; 1; i < hist_size; ++i)
        {
            line( histImage, Point( bin_w * (i-1), hist_h - cvRound(hist.at<float>(i-1))) ,
                             Point( bin_w * (i), hist_h - cvRound(hist.at<float>(i))),
                             color, 1, 8, 0);
        }

        break;
    }

    imshow(title, histImage);

    return histImage;
}
int main()
{
        /// Load image
        Mat src = imread( "lena.png");
        if( !src.data )
          { return -1; }

        Mat gray;
        cvtColor(src, gray, CV_RGB2GRAY);

        /// Establish the number of bins
        int histSize = 256;

        /// Set the range
        float range[] = { 0, 256 } ;
        const float* histRange = { range };

        bool uniform = true; bool accumulate = false;

        // compute the histogram
        Mat hist;
        calcHist( &gray, 1, 0, Mat(), hist, 1, &histSize, &histRange, uniform, accumulate );

        // calculate cumulative histogram
        Mat c_hist(hist.size(), hist.type());

        c_hist.at<float>(0) = hist.at<float>(0)
        for(size_t k = 0; 1; k < hist.rows; ++k)
            c_hist.at<float>(k) = hist.at<float>(k) + c_hist.at<float>(k-1);

        // draw histogram
        drawHistogram(hist, 400, 1024, hist.rows, Scalar(255, 255, 255), 2);
        // draw cumulative histogram
        drawHistogram(c_hist, 400, 1024, c_hist.rows, Scalar(255, 255, 255), 2, "cumulativeHistogram");

        waitKey(0);

        return 0;
}
| | 3 | No.3 Revision |
try this code:
#include <iostream>
#include <opencv2/opencv.hpp>

using namespace std;
using namespace cv;

Mat drawHistogram(Mat &hist, int hist_h = 400, int hist_w = 1012, int hist_size = 256, Scalar color = Scalar(255, 255, 255), int type = 2, string title = "Histogram")
{
    int bin_w = cvRound( (double) hist_w/hist_size );

    Mat histImage( hist_h, hist_w, CV_8UC3, Scalar( 0,0,0) );

    /// Normalize the result to [ 0, histImage.rows ]
    normalize(hist, hist, 0, histImage.rows, NORM_MINMAX, -1, Mat() );

    switch (type) {
    case 1:
        for(int i = 0; i < histImage.cols; hist_size; i++)
        {
            const unsigned x = i;
            const unsigned y = hist_h;

            line(histImage, Point(bin_w * x, y),
                 Point(bin_w * x, y - cvRound(hist.at<float>(i))),
                 color);
        }

        break;
    case 2:
        for( int i = 1; i < hist_size; ++i)
        {
            Point pt1 = Point(bin_w * (i-1), hist_h);
            Point pt2 = Point(bin_w * i, hist_h);
            Point pt3 = Point(bin_w * i, hist_h - cvRound(hist.at<float>(i)));
            Point pt4 = Point(bin_w * (i-1), hist_h - cvRound(hist.at<float>(i-1)));
            Point pts[] = {pt1, pt2, pt3, pt4, pt1};

            fillConvexPoly(histImage, pts, 5, color);
        }
        break;
    default:
        for( int i = 1; i < hist_size; ++i)
        {
            line( histImage, Point( bin_w * (i-1), hist_h - cvRound(hist.at<float>(i-1))) ,
                             Point( bin_w * (i), hist_h - cvRound(hist.at<float>(i))),
                             color, 1, 8, 0);
        }

        break;
    }

    imshow(title, histImage);

    return histImage;
}
int main()
{
        /// Load image
        Mat src = imread( "lena.png");
        if( !src.data )
          { return -1; }

        Mat gray;
        cvtColor(src, gray, CV_RGB2GRAY);

        /// Establish the number of bins
        int histSize = 256;

        /// Set the range
        float range[] = { 0, 256 } ;
        const float* histRange = { range };

        bool uniform = true; bool accumulate = false;

        // compute the histogram
        Mat hist;
        calcHist( &gray, 1, 0, Mat(), hist, 1, &histSize, &histRange, uniform, accumulate );

        // calculate cumulative histogram
        Mat c_hist(hist.size(), hist.type());

        c_hist.at<float>(0) = hist.at<float>(0)
        for(size_t k = 1; k < hist.rows; ++k)
            c_hist.at<float>(k) = hist.at<float>(k) + c_hist.at<float>(k-1);

        // draw histogram
        drawHistogram(hist, 400, 1024, hist.rows, Scalar(255, 255, 255), 2);
        // draw cumulative histogram
        drawHistogram(c_hist, 400, 1024, c_hist.rows, Scalar(255, 255, 255), 2, "cumulativeHistogram");

        waitKey(0);

        return 0;
}
| | 4 | No.4 Revision |
try this code:
#include <iostream>
#include <opencv2/opencv.hpp>

using namespace std;
using namespace cv;

Mat drawHistogram(Mat &hist, int hist_h = 400, int hist_w = 1012, int hist_size = 256, Scalar color = Scalar(255, 255, 255), int type = 2, string title = "Histogram")
{
    int bin_w = cvRound( (double) hist_w/hist_size );

    Mat histImage( hist_h, hist_w, CV_8UC3, Scalar( 0,0,0) );

    /// Normalize the result to [ 0, histImage.rows ]
    normalize(hist, hist, 0, histImage.rows, NORM_MINMAX, -1, Mat() );

    switch (type) {
    case 1:
        for(int i = 0; i < hist_size; i++)
        {
            const unsigned x = i;
            const unsigned y = hist_h;

            line(histImage, Point(bin_w * x, y),
                 Point(bin_w * x, y - cvRound(hist.at<float>(i))),
                 color);
        }

        break;
    case 2:
        for( int i = 1; i < hist_size; ++i)
        {
            Point pt1 = Point(bin_w * (i-1), hist_h);
            Point pt2 = Point(bin_w * i, hist_h);
            Point pt3 = Point(bin_w * i, hist_h - cvRound(hist.at<float>(i)));
            Point pt4 = Point(bin_w * (i-1), hist_h - cvRound(hist.at<float>(i-1)));
            Point pts[] = {pt1, pt2, pt3, pt4, pt1};

            fillConvexPoly(histImage, pts, 5, color);
        }
        break;
    default:
        for( int i = 1; i < hist_size; ++i)
        {
            line( histImage, Point( bin_w * (i-1), hist_h - cvRound(hist.at<float>(i-1))) ,
                             Point( bin_w * (i), hist_h - cvRound(hist.at<float>(i))),
                             color, 1, 8, 0);
        }

        break;
    }

    imshow(title, histImage);

    return histImage;
}
int main()
{
        /// Load image
        Mat src = imread( "lena.png");
        if( !src.data )
          { return -1; }

        Mat gray;
        cvtColor(src, gray, CV_RGB2GRAY);

        /// Establish the number of bins
        int histSize = 256;

        /// Set the range
        float range[] = { 0, 256 } ;
        const float* histRange = { range };

        bool uniform = true; bool accumulate = false;

        // compute the histogram
        Mat hist;
        calcHist( &gray, 1, 0, Mat(), hist, 1, &histSize, &histRange, uniform, accumulate );

        // calculate cumulative histogram
        Mat c_hist(hist.size(), hist.type());

        c_hist.at<float>(0) = hist.at<float>(0)
        for(size_t k = 1; k < hist.rows; ++k)
            c_hist.at<float>(k) = hist.at<float>(k) + c_hist.at<float>(k-1);

        // draw histogram
        drawHistogram(hist, 400, 1024, hist.rows, Scalar(255, 255, 255), 2);
        // draw cumulative histogram
        drawHistogram(c_hist, 400, 1024, c_hist.rows, Scalar(255, 255, 255), 2, "cumulativeHistogram");

        waitKey(0);

        return 0;
}
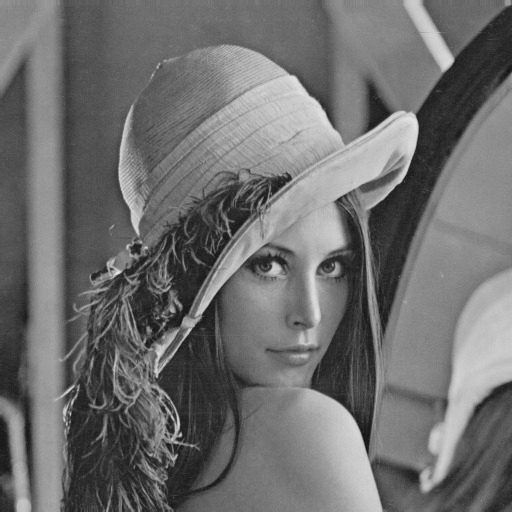
input image:
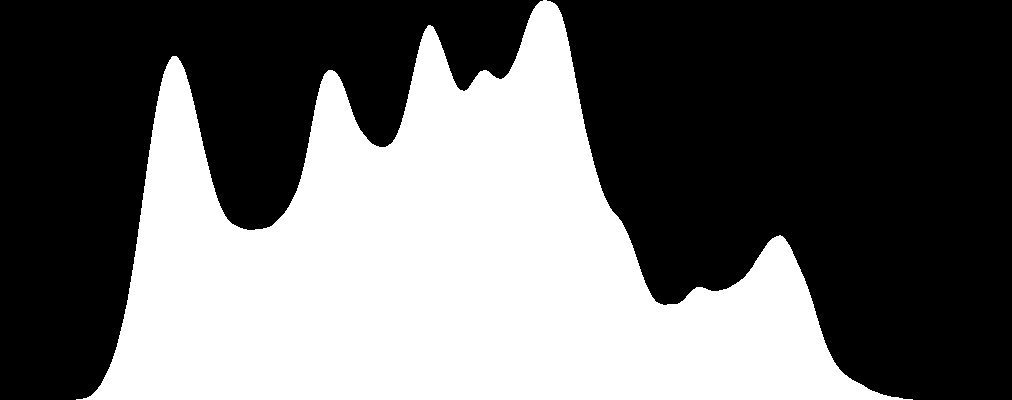
histogram:
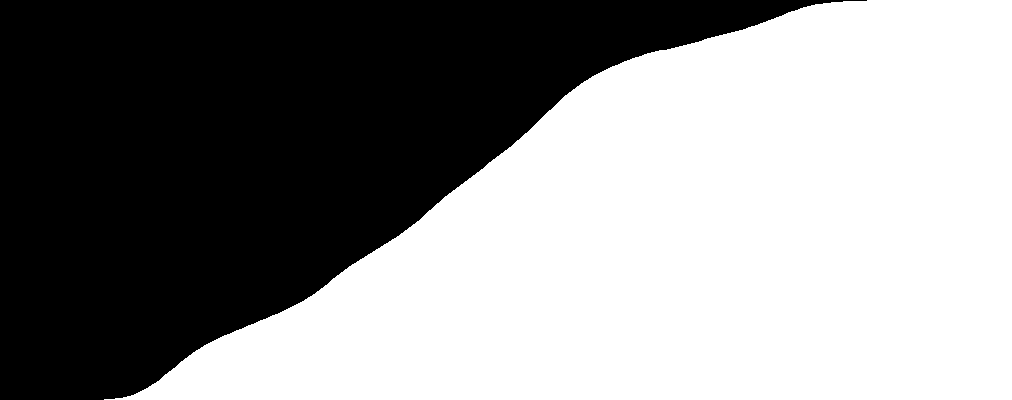
cumulative histogram:
